29
/
en
AIzaSyAYiBZKx7MnpbEhh9jyipgxe19OcubqV5w
April 1, 2024
107306
Colombia
COL
true
2
1
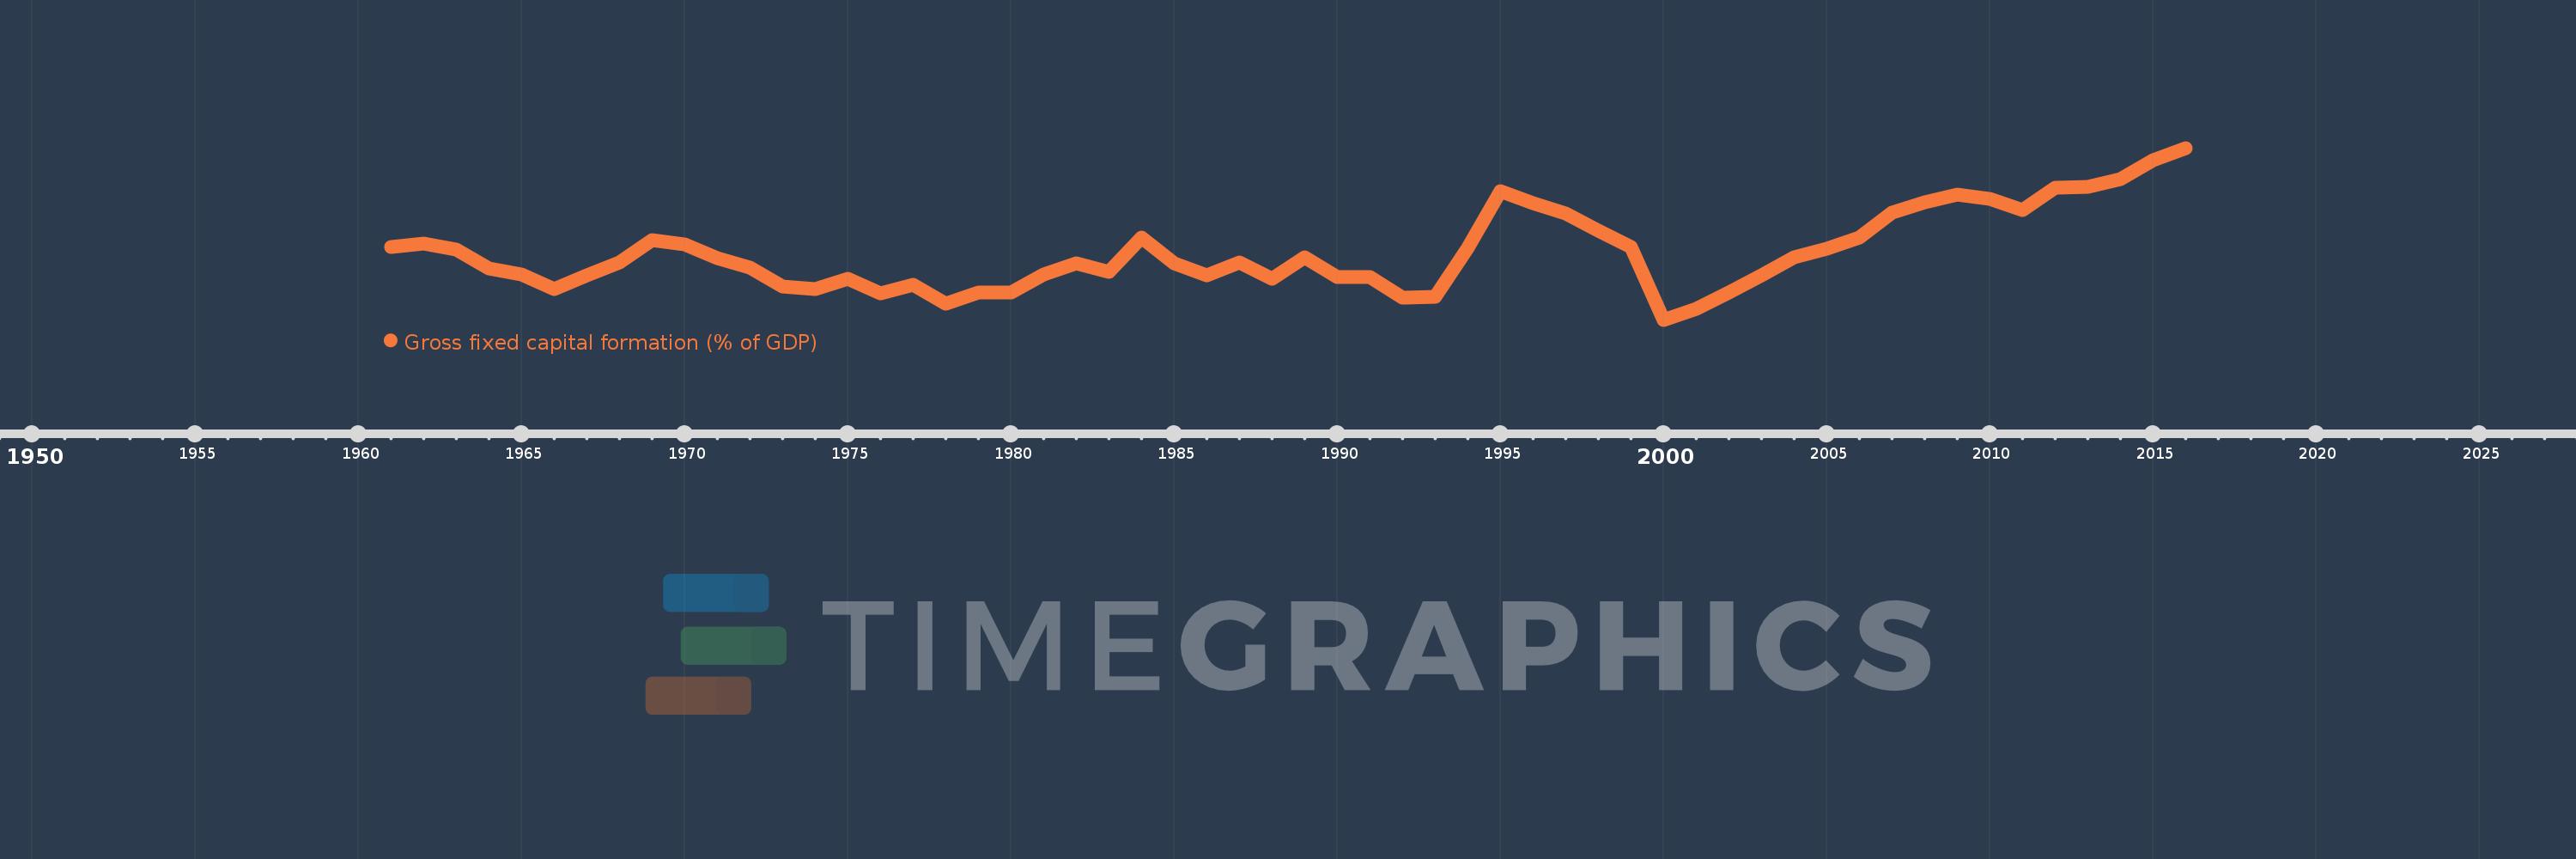
Gross fixed capital formation (% of GDP)
2016,2015,2014,2013,2012,2011,2010,2009,2008,2007,2006,2005,2004,2003,2002,2001,2000,1999,1998,1997,1996,1995,1994,1993,1992,1991,1990,1989,1988,1987,1986,1985,1984,1983,1982,1981,1980,1979,1978,1977,1976,1975,1974,1973,1972,1971,1970,1969,1968,1967,1966,1965,1964,1963,1962,1961
This statistics in other country:
AfghanistanAlbaniaAlgeriaAngolaAntigua and BarbudaArab WorldArgentinaArmeniaArubaAustraliaAustriaAzerbaijanBahamas, TheBahrainBangladeshBarbadosBelarusBelgiumBelizeBeninBermudaBhutanBoliviaBosnia and HerzegovinaBotswanaBrazilBrunei DarussalamBulgariaBurkina FasoBurundiCabo VerdeCambodiaCameroonCanadaCaribbean small statesCentral African RepublicCentral Europe and the BalticsChadChileChinaColombiaComorosCongo, Dem. Rep.Congo, Rep.Costa RicaCote d'IvoireCroatiaCubaCyprusCzech RepublicDenmarkDjiboutiDominicaDominican RepublicEarly-demographic dividendEast Asia & PacificEast Asia & Pacific (excluding high income)East Asia & Pacific (IDA & IBRD countries)EcuadorEgypt, Arab Rep.El SalvadorEquatorial GuineaEritreaEstoniaEthiopiaEuro areaEurope & Central AsiaEurope & Central Asia (excluding high income)Europe & Central Asia (IDA & IBRD countries)European UnionFijiFinlandFragile and conflict affected situationsFranceGabonGambia, TheGeorgiaGermanyGhanaGreeceGrenadaGuatemalaGuineaGuinea-BissauGuyanaHaitiHeavily indebted poor countries (HIPC)High incomeHondurasHong Kong SAR, ChinaHungaryIBRD onlyIcelandIDA & IBRD totalIDA blendIDA onlyIDA totalIndiaIndonesiaIran, Islamic Rep.IraqIrelandIsraelItalyJamaicaJapanJordanKazakhstanKenyaKiribatiKorea, Rep.KosovoKuwaitKyrgyz RepublicLao PDRLate-demographic dividendLatin America & Caribbean Latin America & Caribbean (excluding high income)Latin America & the Caribbean (IDA & IBRD countries)LatviaLeast developed countries: UN classificationLebanonLesothoLiberiaLibyaLithuaniaLow & middle incomeLow incomeLower middle incomeLuxembourgMacao SAR, ChinaMacedonia, FYRMadagascarMalawiMalaysiaMaldivesMaliMaltaMauritaniaMauritiusMexicoMicronesia, Fed. Sts.Middle East & North AfricaMiddle East & North Africa (excluding high income)Middle East & North Africa (IDA & IBRD countries)Middle incomeMoldovaMongoliaMontenegroMoroccoMozambiqueNamibiaNepalNetherlandsNew CaledoniaNew ZealandNicaraguaNigerNigeriaNorth AmericaNorwayOECD membersOmanPacific island small statesPakistanPanamaPapua New GuineaParaguayPeruPhilippinesPolandPortugalPost-demographic dividendPre-demographic dividendPuerto RicoRomaniaRussian FederationRwandaSaudi ArabiaSenegalSerbiaSeychellesSierra LeoneSingaporeSlovak RepublicSloveniaSolomon IslandsSomaliaSouth AfricaSouth AsiaSouth Asia (IDA & IBRD)South SudanSpainSri LankaSt. Kitts and NevisSt. LuciaSt. Vincent and the GrenadinesSub-Saharan Africa Sub-Saharan Africa (excluding high income)Sub-Saharan Africa (IDA & IBRD countries)SudanSurinameSwazilandSwedenSwitzerlandSyrian Arab RepublicTajikistanTanzaniaThailandTimor-LesteTogoTongaTrinidad and TobagoTunisiaTurkeyTurkmenistanUgandaUkraineUnited Arab EmiratesUnited KingdomUnited StatesUpper middle incomeUruguayUzbekistanVanuatuVenezuela, RBVietnamWest Bank and GazaWorldYemen, Rep.ZambiaZimbabwe Timeline:
This timeline shows a graph from 1961 to 2016 of Colombia. No data until 1960. Number of actual observations by date: 56.
Source name:
World Development Indicators
Source organization:
World Bank national accounts data, and OECD National Accounts data files.
Categories, topics:
Economy & Growth
Last updated:
apr 23, 2017
Indicators value changes by year
Minimum:
13.248
jan 1, 2000
Maximum:
26.703
jan 1, 2016
At the date of observation
Value
Absolute change
Change from previous value
jan 1, 1961
18.939
+18.939
0.0%
jan 1, 1962
19.193
+0.254
1.34%
jan 1, 1963
18.774
-0.419
-2.18%
jan 1, 1964
17.267
-1.507
-8.03%
jan 1, 1965
16.825
-0.442
-2.56%
jan 1, 1966
15.633
-1.192
-7.09%
jan 1, 1967
16.714
+1.082
6.92%
jan 1, 1968
17.728
+1.014
6.07%
jan 1, 1969
19.513
+1.785
10.07%
jan 1, 1970
19.134
-0.379
-1.94%
jan 1, 1971
18.077
-1.058
-5.53%
jan 1, 1972
17.32
-0.756
-4.18%
jan 1, 1973
15.822
-1.499
-8.65%
jan 1, 1974
15.628
-0.194
-1.23%
jan 1, 1975
16.44
+0.812
5.2%
jan 1, 1976
15.305
-1.135
-6.91%
jan 1, 1977
15.969
+0.665
4.34%
jan 1, 1978
14.525
-1.445
-9.05%
jan 1, 1979
15.393
+0.869
5.98%
jan 1, 1980
15.393
+0.0
0.0%
jan 1, 1981
16.781
+1.388
9.02%
jan 1, 1982
17.652
+0.871
5.19%
jan 1, 1983
17.018
-0.634
-3.59%
jan 1, 1984
19.678
+2.66
15.63%
jan 1, 1985
17.684
-1.994
-10.13%
jan 1, 1986
16.714
-0.97
-5.49%
jan 1, 1987
17.739
+1.025
6.13%
jan 1, 1988
16.488
-1.251
-7.05%
jan 1, 1989
18.156
+1.668
10.12%
jan 1, 1990
16.587
-1.57
-8.65%
jan 1, 1991
16.591
+0.004
0.03%
jan 1, 1992
14.962
-1.629
-9.82%
jan 1, 1993
15.068
+0.106
0.71%
jan 1, 1994
18.891
+3.824
25.38%
jan 1, 1995
23.288
+4.397
23.27%
jan 1, 1996
22.396
-0.892
-3.83%
jan 1, 1997
21.596
-0.8
-3.57%
jan 1, 1998
20.206
-1.39
-6.44%
jan 1, 1999
18.936
-1.269
-6.28%
jan 1, 2000
13.248
-5.689
-30.04%
jan 1, 2001
14.129
+0.881
6.65%
jan 1, 2002
15.4
+1.27
8.99%
jan 1, 2003
16.725
+1.326
8.61%
jan 1, 2004
18.11
+1.384
8.28%
jan 1, 2005
18.832
+0.722
3.99%
jan 1, 2006
19.666
+0.834
4.43%
jan 1, 2007
21.605
+1.94
9.86%
jan 1, 2008
22.461
+0.855
3.96%
jan 1, 2009
23.076
+0.615
2.74%
jan 1, 2010
22.695
-0.381
-1.65%
jan 1, 2011
21.855
-0.841
-3.7%
jan 1, 2012
23.604
+1.749
8.0%
jan 1, 2013
23.687
+0.084
0.35%
jan 1, 2014
24.256
+0.569
2.4%
jan 1, 2015
25.766
+1.51
6.22%
jan 1, 2016
26.703
+0.937
3.64%
Ranking of countries by current statistics by years


Comments: