29
/
en
AIzaSyAYiBZKx7MnpbEhh9jyipgxe19OcubqV5w
April 1, 2024
82840
Belize
BLZ
true
2
1
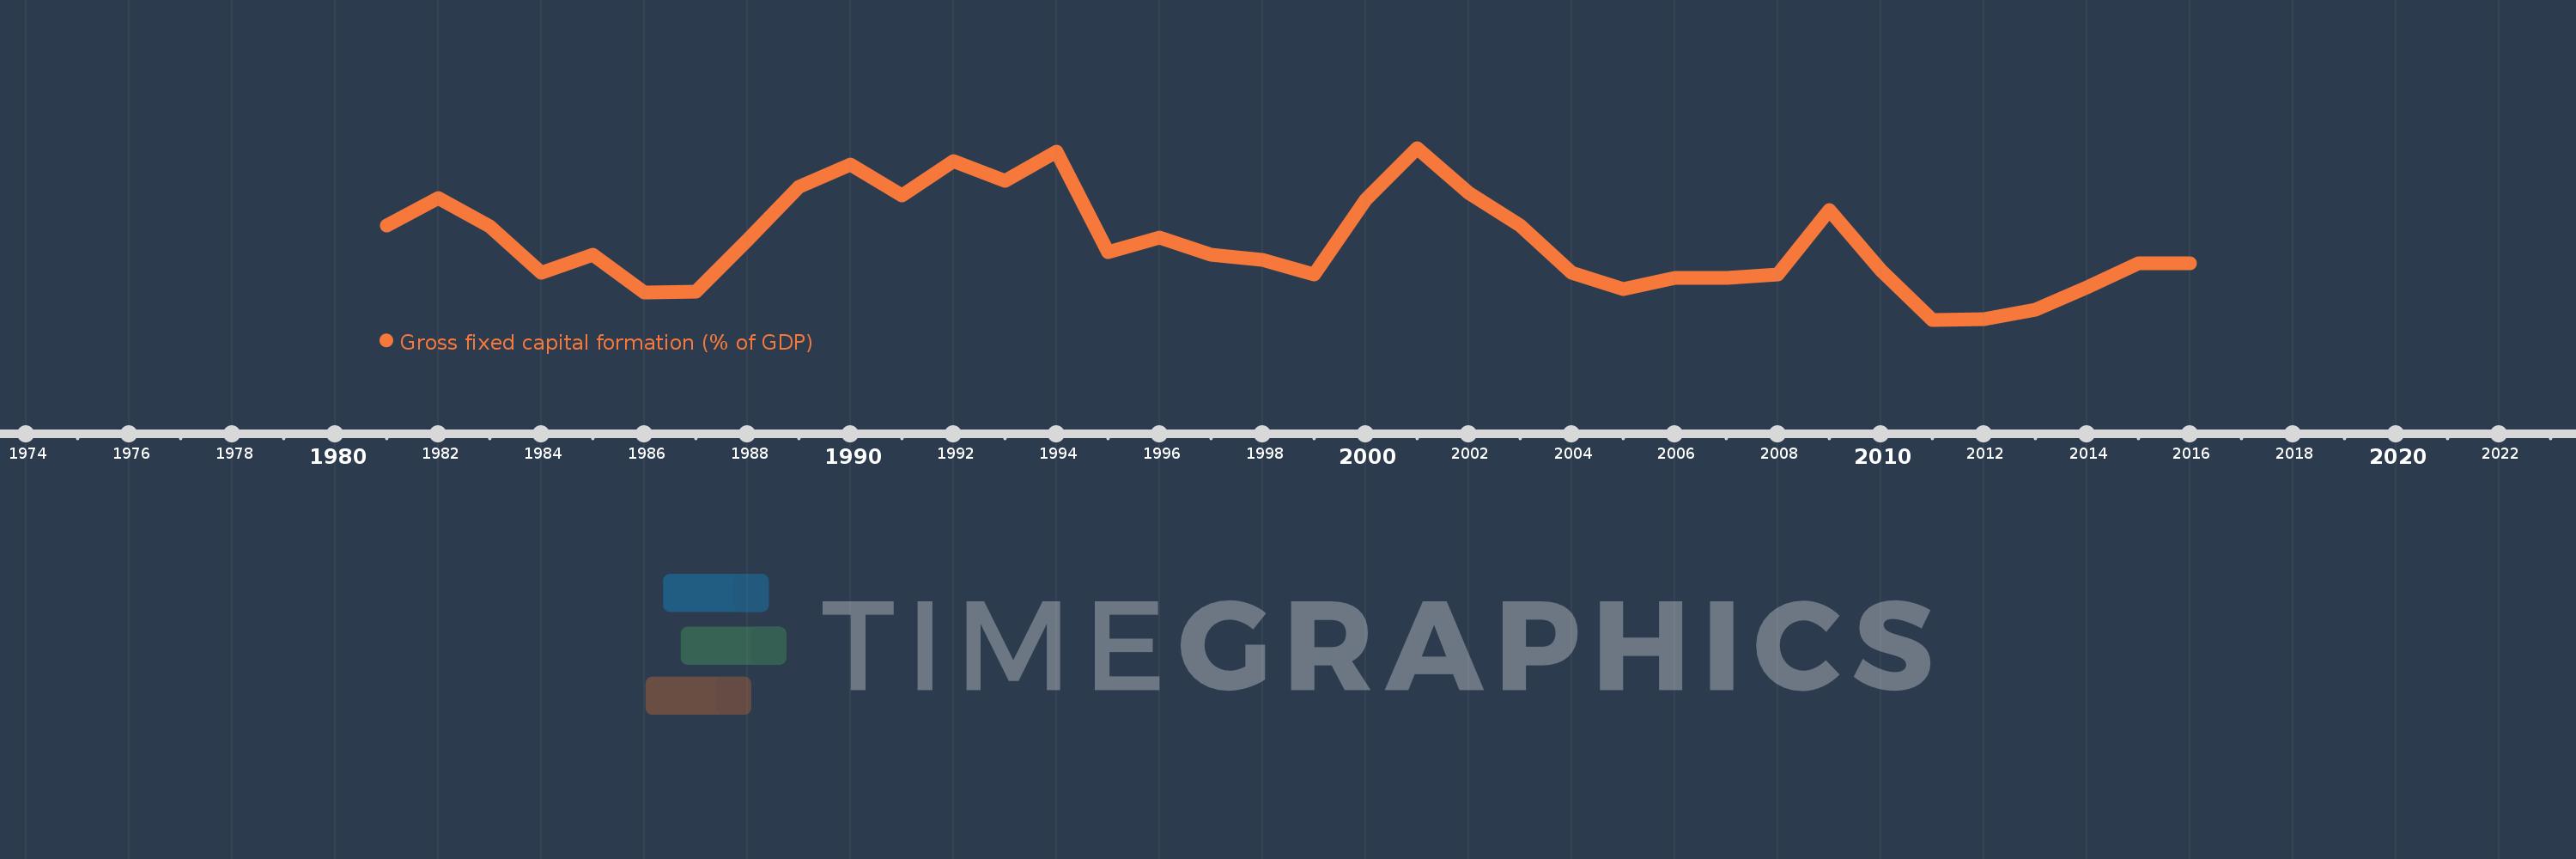
Gross fixed capital formation (% of GDP)
2016,2015,2014,2013,2012,2011,2010,2009,2008,2007,2006,2005,2004,2003,2002,2001,2000,1999,1998,1997,1996,1995,1994,1993,1992,1991,1990,1989,1988,1987,1986,1985,1984,1983,1982,1981
This statistics in other country:
AfghanistanAlbaniaAlgeriaAngolaAntigua and BarbudaArab WorldArgentinaArmeniaArubaAustraliaAustriaAzerbaijanBahamas, TheBahrainBangladeshBarbadosBelarusBelgiumBelizeBeninBermudaBhutanBoliviaBosnia and HerzegovinaBotswanaBrazilBrunei DarussalamBulgariaBurkina FasoBurundiCabo VerdeCambodiaCameroonCanadaCaribbean small statesCentral African RepublicCentral Europe and the BalticsChadChileChinaColombiaComorosCongo, Dem. Rep.Congo, Rep.Costa RicaCote d'IvoireCroatiaCubaCyprusCzech RepublicDenmarkDjiboutiDominicaDominican RepublicEarly-demographic dividendEast Asia & PacificEast Asia & Pacific (excluding high income)East Asia & Pacific (IDA & IBRD countries)EcuadorEgypt, Arab Rep.El SalvadorEquatorial GuineaEritreaEstoniaEthiopiaEuro areaEurope & Central AsiaEurope & Central Asia (excluding high income)Europe & Central Asia (IDA & IBRD countries)European UnionFijiFinlandFragile and conflict affected situationsFranceGabonGambia, TheGeorgiaGermanyGhanaGreeceGrenadaGuatemalaGuineaGuinea-BissauGuyanaHaitiHeavily indebted poor countries (HIPC)High incomeHondurasHong Kong SAR, ChinaHungaryIBRD onlyIcelandIDA & IBRD totalIDA blendIDA onlyIDA totalIndiaIndonesiaIran, Islamic Rep.IraqIrelandIsraelItalyJamaicaJapanJordanKazakhstanKenyaKiribatiKorea, Rep.KosovoKuwaitKyrgyz RepublicLao PDRLate-demographic dividendLatin America & Caribbean Latin America & Caribbean (excluding high income)Latin America & the Caribbean (IDA & IBRD countries)LatviaLeast developed countries: UN classificationLebanonLesothoLiberiaLibyaLithuaniaLow & middle incomeLow incomeLower middle incomeLuxembourgMacao SAR, ChinaMacedonia, FYRMadagascarMalawiMalaysiaMaldivesMaliMaltaMauritaniaMauritiusMexicoMicronesia, Fed. Sts.Middle East & North AfricaMiddle East & North Africa (excluding high income)Middle East & North Africa (IDA & IBRD countries)Middle incomeMoldovaMongoliaMontenegroMoroccoMozambiqueNamibiaNepalNetherlandsNew CaledoniaNew ZealandNicaraguaNigerNigeriaNorth AmericaNorwayOECD membersOmanPacific island small statesPakistanPanamaPapua New GuineaParaguayPeruPhilippinesPolandPortugalPost-demographic dividendPre-demographic dividendPuerto RicoRomaniaRussian FederationRwandaSaudi ArabiaSenegalSerbiaSeychellesSierra LeoneSingaporeSlovak RepublicSloveniaSolomon IslandsSomaliaSouth AfricaSouth AsiaSouth Asia (IDA & IBRD)South SudanSpainSri LankaSt. Kitts and NevisSt. LuciaSt. Vincent and the GrenadinesSub-Saharan Africa Sub-Saharan Africa (excluding high income)Sub-Saharan Africa (IDA & IBRD countries)SudanSurinameSwazilandSwedenSwitzerlandSyrian Arab RepublicTajikistanTanzaniaThailandTimor-LesteTogoTongaTrinidad and TobagoTunisiaTurkeyTurkmenistanUgandaUkraineUnited Arab EmiratesUnited KingdomUnited StatesUpper middle incomeUruguayUzbekistanVanuatuVenezuela, RBVietnamWest Bank and GazaWorldYemen, Rep.ZambiaZimbabwe Timeline:
This timeline shows a graph from 1981 to 2016 of Belize. No data until 1980. Number of actual observations by date: 36.
Source name:
World Development Indicators
Source organization:
World Bank national accounts data, and OECD National Accounts data files.
Categories, topics:
Economy & Growth
Last updated:
apr 23, 2017
Indicators value changes by year
Minimum:
15.277
jan 1, 2011
Maximum:
28.662
jan 1, 2001
At the date of observation
Value
Absolute change
Change from previous value
jan 1, 1981
22.644
+22.644
0.0%
jan 1, 1982
24.78
+2.135
9.43%
jan 1, 1983
22.538
-2.241
-9.05%
jan 1, 1984
18.915
-3.623
-16.07%
jan 1, 1985
20.318
+1.402
7.41%
jan 1, 1986
17.38
-2.938
-14.46%
jan 1, 1987
17.446
+0.066
0.38%
jan 1, 1988
21.479
+4.033
23.12%
jan 1, 1989
25.659
+4.18
19.46%
jan 1, 1990
27.372
+1.713
6.67%
jan 1, 1991
24.973
-2.399
-8.76%
jan 1, 1992
27.647
+2.674
10.71%
jan 1, 1993
26.084
-1.563
-5.65%
jan 1, 1994
28.358
+2.274
8.72%
jan 1, 1995
20.552
-7.806
-27.53%
jan 1, 1996
21.707
+1.155
5.62%
jan 1, 1997
20.313
-1.394
-6.42%
jan 1, 1998
19.941
-0.372
-1.83%
jan 1, 1999
18.794
-1.148
-5.76%
jan 1, 2000
24.593
+5.8
30.86%
jan 1, 2001
28.662
+4.069
16.55%
jan 1, 2002
25.142
-3.52
-12.28%
jan 1, 2003
22.599
-2.543
-10.12%
jan 1, 2004
18.921
-3.678
-16.27%
jan 1, 2005
17.642
-1.28
-6.76%
jan 1, 2006
18.517
+0.875
4.96%
jan 1, 2007
18.508
-0.009
-0.05%
jan 1, 2008
18.801
+0.293
1.58%
jan 1, 2009
23.806
+5.005
26.62%
jan 1, 2010
19.115
-4.69
-19.7%
jan 1, 2011
15.277
-3.839
-20.08%
jan 1, 2012
15.331
+0.055
0.36%
jan 1, 2013
16.065
+0.733
4.78%
jan 1, 2014
17.832
+1.767
11.0%
jan 1, 2015
19.682
+1.85
10.37%
jan 1, 2016
19.682
0.0
0.0%
Ranking of countries by current statistics by years


Comments: