29
/
en
AIzaSyAYiBZKx7MnpbEhh9jyipgxe19OcubqV5w
April 1, 2024
103661
Chad
TCD
true
2
1
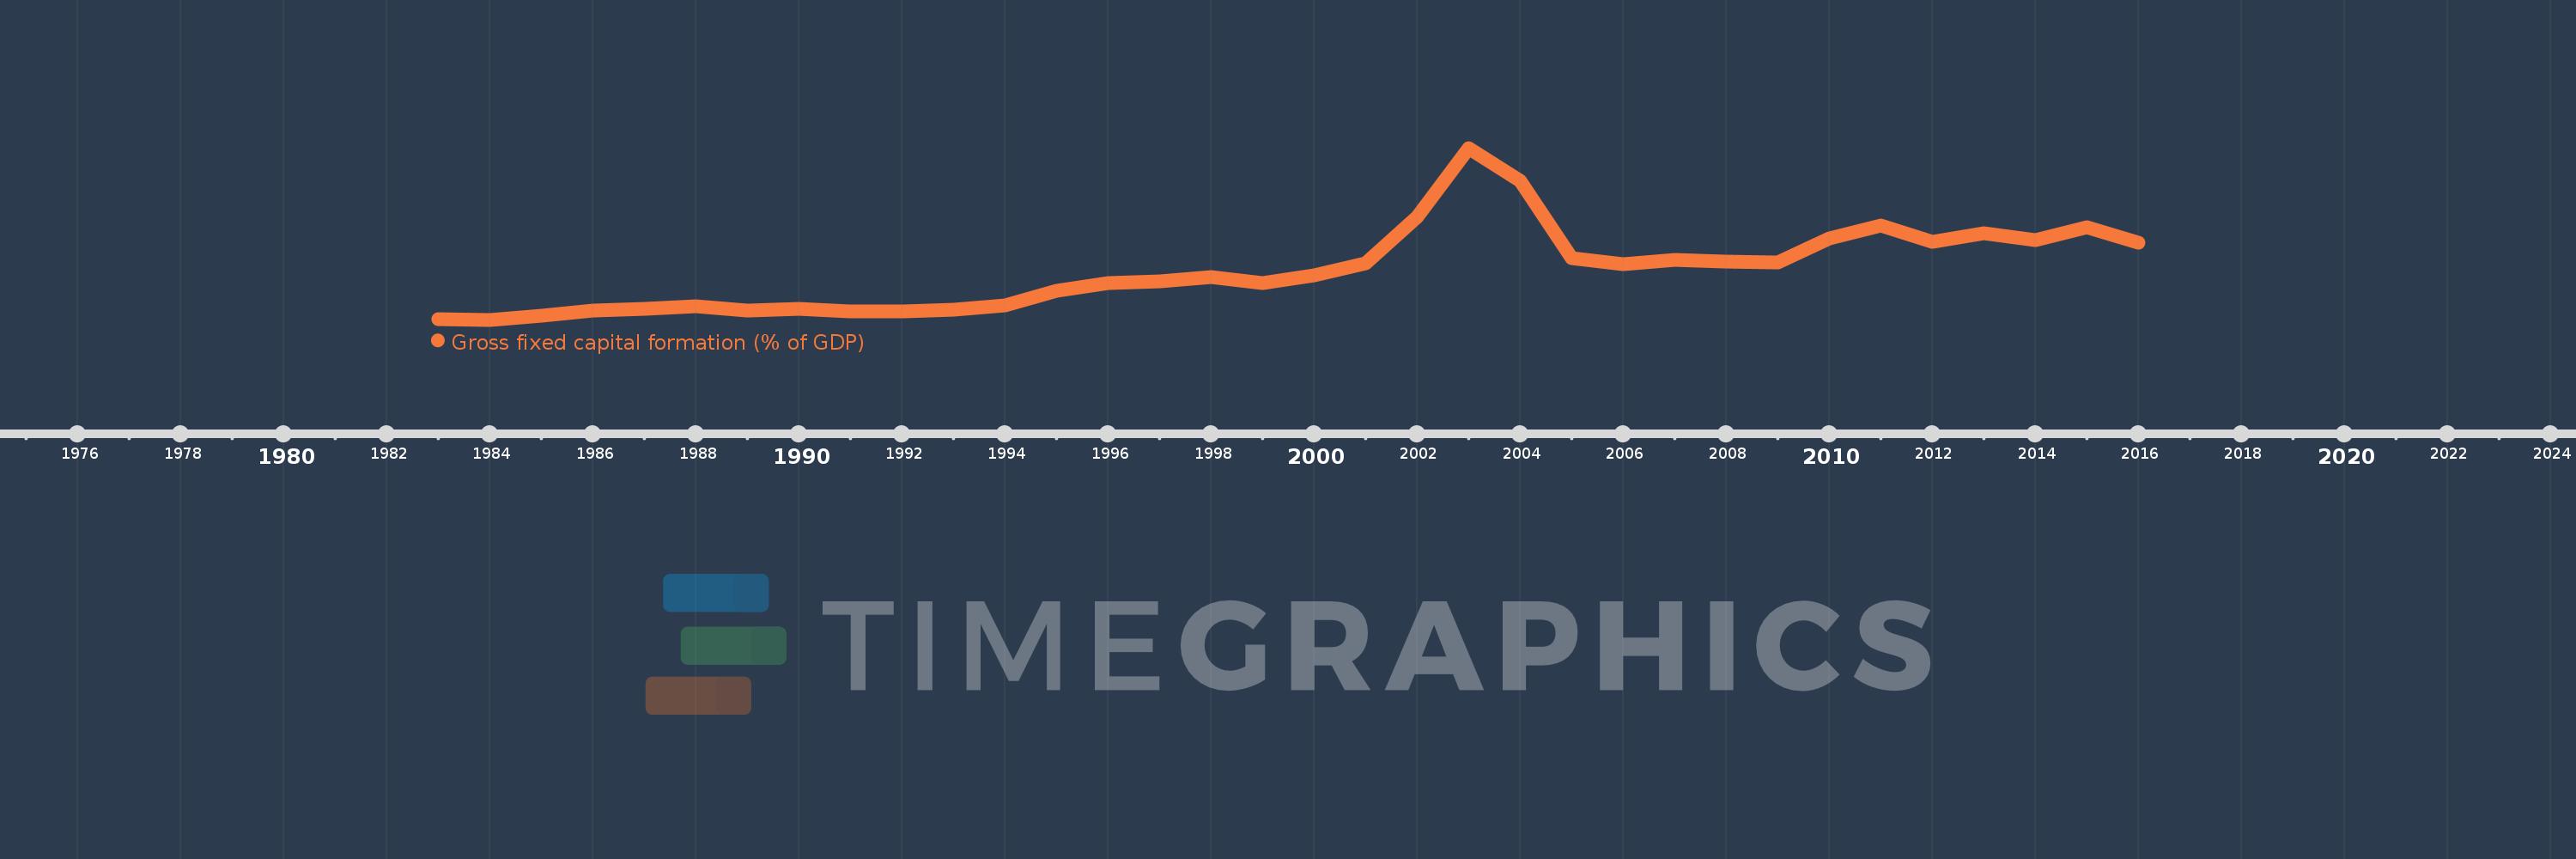
Gross fixed capital formation (% of GDP)
2016,2015,2014,2013,2012,2011,2010,2009,2008,2007,2006,2005,2004,2003,2002,2001,2000,1999,1998,1997,1996,1995,1994,1993,1992,1991,1990,1989,1988,1987,1986,1985,1984,1983
This statistics in other country:
AfghanistanAlbaniaAlgeriaAngolaAntigua and BarbudaArab WorldArgentinaArmeniaArubaAustraliaAustriaAzerbaijanBahamas, TheBahrainBangladeshBarbadosBelarusBelgiumBelizeBeninBermudaBhutanBoliviaBosnia and HerzegovinaBotswanaBrazilBrunei DarussalamBulgariaBurkina FasoBurundiCabo VerdeCambodiaCameroonCanadaCaribbean small statesCentral African RepublicCentral Europe and the BalticsChadChileChinaColombiaComorosCongo, Dem. Rep.Congo, Rep.Costa RicaCote d'IvoireCroatiaCubaCyprusCzech RepublicDenmarkDjiboutiDominicaDominican RepublicEarly-demographic dividendEast Asia & PacificEast Asia & Pacific (excluding high income)East Asia & Pacific (IDA & IBRD countries)EcuadorEgypt, Arab Rep.El SalvadorEquatorial GuineaEritreaEstoniaEthiopiaEuro areaEurope & Central AsiaEurope & Central Asia (excluding high income)Europe & Central Asia (IDA & IBRD countries)European UnionFijiFinlandFragile and conflict affected situationsFranceGabonGambia, TheGeorgiaGermanyGhanaGreeceGrenadaGuatemalaGuineaGuinea-BissauGuyanaHaitiHeavily indebted poor countries (HIPC)High incomeHondurasHong Kong SAR, ChinaHungaryIBRD onlyIcelandIDA & IBRD totalIDA blendIDA onlyIDA totalIndiaIndonesiaIran, Islamic Rep.IraqIrelandIsraelItalyJamaicaJapanJordanKazakhstanKenyaKiribatiKorea, Rep.KosovoKuwaitKyrgyz RepublicLao PDRLate-demographic dividendLatin America & Caribbean Latin America & Caribbean (excluding high income)Latin America & the Caribbean (IDA & IBRD countries)LatviaLeast developed countries: UN classificationLebanonLesothoLiberiaLibyaLithuaniaLow & middle incomeLow incomeLower middle incomeLuxembourgMacao SAR, ChinaMacedonia, FYRMadagascarMalawiMalaysiaMaldivesMaliMaltaMauritaniaMauritiusMexicoMicronesia, Fed. Sts.Middle East & North AfricaMiddle East & North Africa (excluding high income)Middle East & North Africa (IDA & IBRD countries)Middle incomeMoldovaMongoliaMontenegroMoroccoMozambiqueNamibiaNepalNetherlandsNew CaledoniaNew ZealandNicaraguaNigerNigeriaNorth AmericaNorwayOECD membersOmanPacific island small statesPakistanPanamaPapua New GuineaParaguayPeruPhilippinesPolandPortugalPost-demographic dividendPre-demographic dividendPuerto RicoRomaniaRussian FederationRwandaSaudi ArabiaSenegalSerbiaSeychellesSierra LeoneSingaporeSlovak RepublicSloveniaSolomon IslandsSomaliaSouth AfricaSouth AsiaSouth Asia (IDA & IBRD)South SudanSpainSri LankaSt. Kitts and NevisSt. LuciaSt. Vincent and the GrenadinesSub-Saharan Africa Sub-Saharan Africa (excluding high income)Sub-Saharan Africa (IDA & IBRD countries)SudanSurinameSwazilandSwedenSwitzerlandSyrian Arab RepublicTajikistanTanzaniaThailandTimor-LesteTogoTongaTrinidad and TobagoTunisiaTurkeyTurkmenistanUgandaUkraineUnited Arab EmiratesUnited KingdomUnited StatesUpper middle incomeUruguayUzbekistanVanuatuVenezuela, RBVietnamWest Bank and GazaWorldYemen, Rep.ZambiaZimbabwe Timeline:
This timeline shows a graph from 1983 to 2016 of Chad. No data until 1982. Number of actual observations by date: 34.
Source name:
World Development Indicators
Source organization:
World Bank national accounts data, and OECD National Accounts data files.
Categories, topics:
Economy & Growth
Last updated:
apr 23, 2017
Indicators value changes by year
Maximum:
59.723
jan 1, 2003
At the date of observation
Value
Absolute change
Change from previous value
jan 1, 1983
2.234
+2.234
0.0%
jan 1, 1984
1.931
-0.303
-13.56%
jan 1, 1985
3.412
+1.482
76.75%
jan 1, 1986
5.159
+1.746
51.18%
jan 1, 1987
5.745
+0.587
11.37%
jan 1, 1988
6.449
+0.704
12.25%
jan 1, 1989
4.97
-1.479
-22.94%
jan 1, 1990
5.675
+0.705
14.18%
jan 1, 1991
4.772
-0.903
-15.91%
jan 1, 1992
4.622
-0.15
-3.14%
jan 1, 1993
5.276
+0.653
14.14%
jan 1, 1994
6.894
+1.619
30.68%
jan 1, 1995
11.755
+4.861
70.5%
jan 1, 1996
14.357
+2.602
22.14%
jan 1, 1997
14.965
+0.608
4.23%
jan 1, 1998
16.331
+1.366
9.13%
jan 1, 1999
14.145
-2.185
-13.38%
jan 1, 2000
16.972
+2.827
19.98%
jan 1, 2001
20.942
+3.969
23.39%
jan 1, 2002
36.579
+15.638
74.67%
jan 1, 2003
59.723
+23.144
63.27%
jan 1, 2004
48.601
-11.122
-18.62%
jan 1, 2005
22.74
-25.861
-53.21%
jan 1, 2006
20.592
-2.149
-9.45%
jan 1, 2007
22.006
+1.414
6.87%
jan 1, 2008
21.383
-0.623
-2.83%
jan 1, 2009
21.306
-0.077
-0.36%
jan 1, 2010
29.417
+8.111
38.07%
jan 1, 2011
33.622
+4.205
14.3%
jan 1, 2012
28.28
-5.342
-15.89%
jan 1, 2013
31.1
+2.82
9.97%
jan 1, 2014
28.583
-2.518
-8.1%
jan 1, 2015
33.173
+4.591
16.06%
jan 1, 2016
27.961
-5.212
-15.71%
Ranking of countries by current statistics by years


Comments: