29
/
en
AIzaSyAYiBZKx7MnpbEhh9jyipgxe19OcubqV5w
April 1, 2024
154659
India
IND
true
2
1
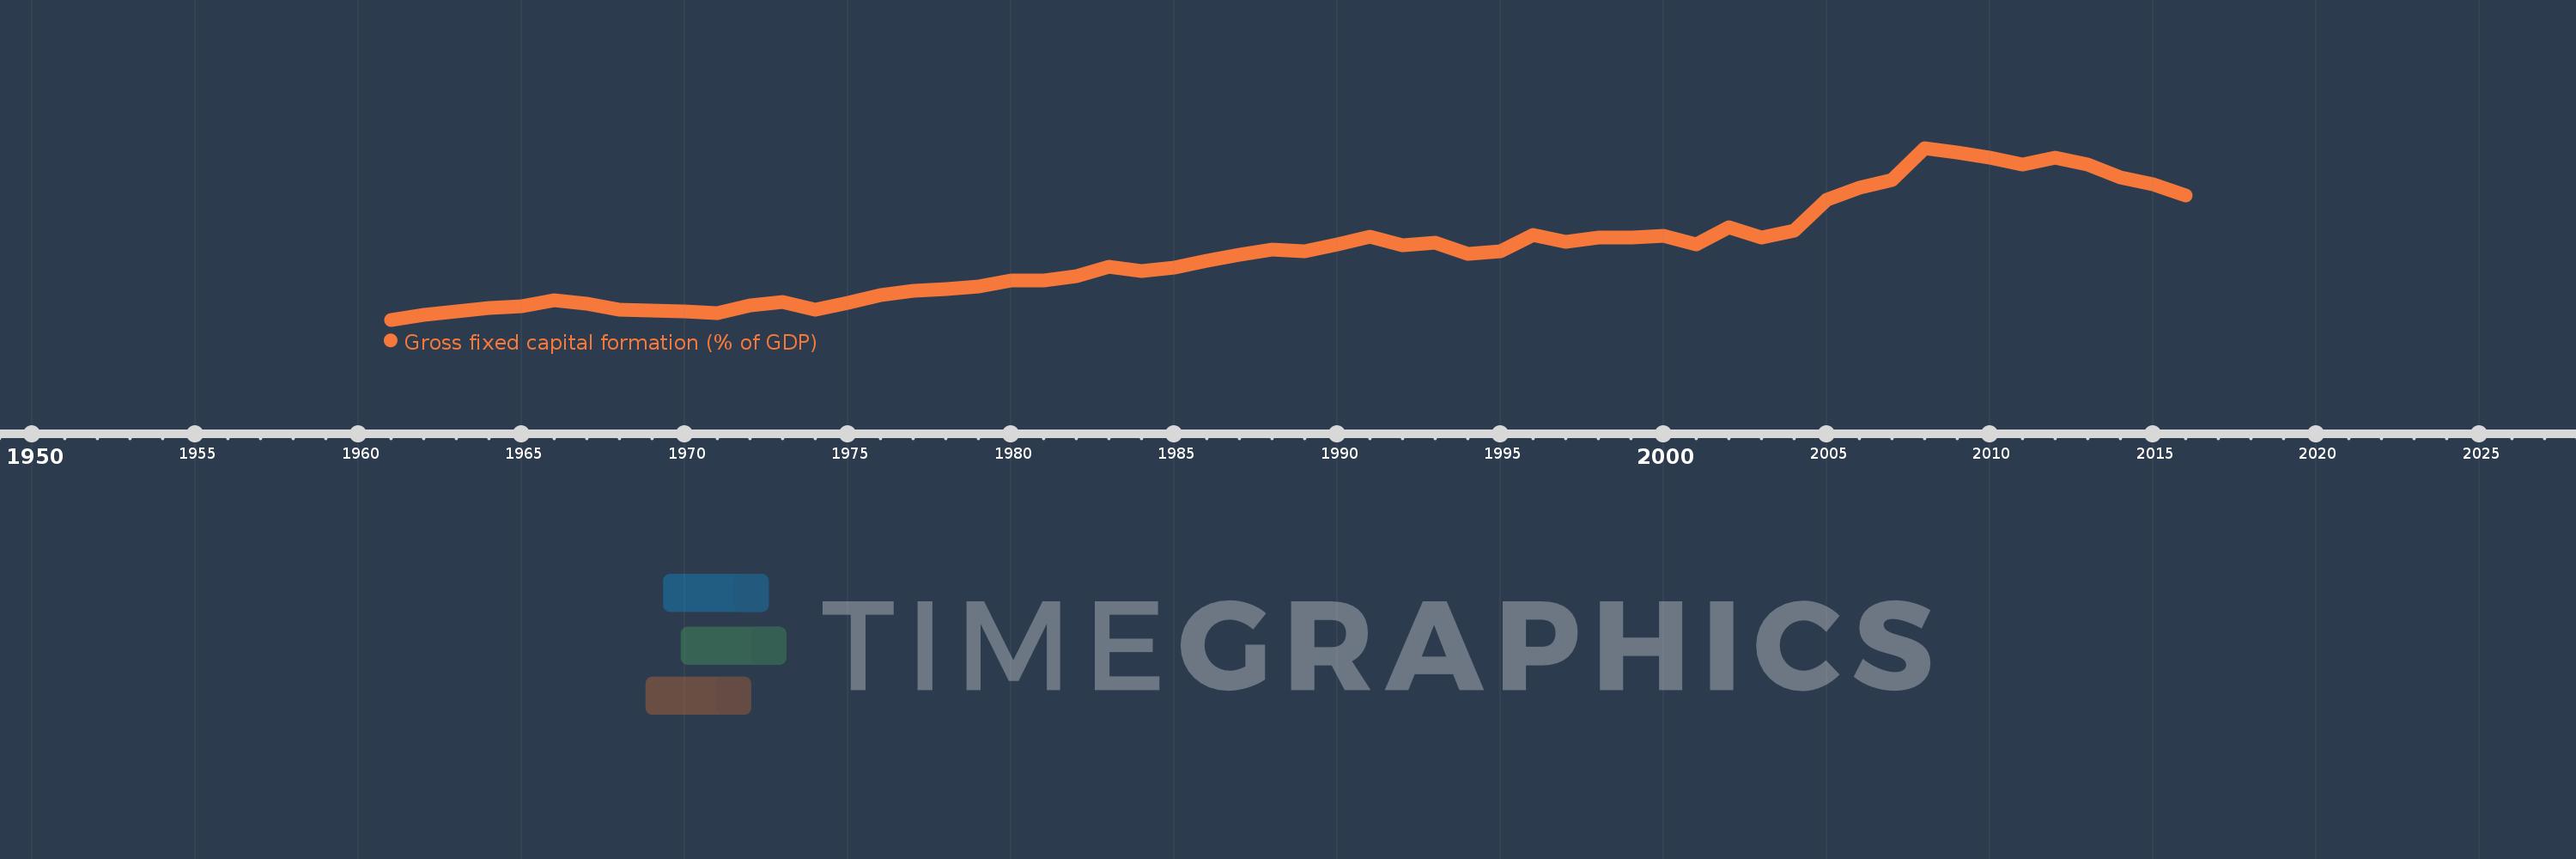
Gross fixed capital formation (% of GDP)
2016,2015,2014,2013,2012,2011,2010,2009,2008,2007,2006,2005,2004,2003,2002,2001,2000,1999,1998,1997,1996,1995,1994,1993,1992,1991,1990,1989,1988,1987,1986,1985,1984,1983,1982,1981,1980,1979,1978,1977,1976,1975,1974,1973,1972,1971,1970,1969,1968,1967,1966,1965,1964,1963,1962,1961
This statistics in other country:
AfghanistanAlbaniaAlgeriaAngolaAntigua and BarbudaArab WorldArgentinaArmeniaArubaAustraliaAustriaAzerbaijanBahamas, TheBahrainBangladeshBarbadosBelarusBelgiumBelizeBeninBermudaBhutanBoliviaBosnia and HerzegovinaBotswanaBrazilBrunei DarussalamBulgariaBurkina FasoBurundiCabo VerdeCambodiaCameroonCanadaCaribbean small statesCentral African RepublicCentral Europe and the BalticsChadChileChinaColombiaComorosCongo, Dem. Rep.Congo, Rep.Costa RicaCote d'IvoireCroatiaCubaCyprusCzech RepublicDenmarkDjiboutiDominicaDominican RepublicEarly-demographic dividendEast Asia & PacificEast Asia & Pacific (excluding high income)East Asia & Pacific (IDA & IBRD countries)EcuadorEgypt, Arab Rep.El SalvadorEquatorial GuineaEritreaEstoniaEthiopiaEuro areaEurope & Central AsiaEurope & Central Asia (excluding high income)Europe & Central Asia (IDA & IBRD countries)European UnionFijiFinlandFragile and conflict affected situationsFranceGabonGambia, TheGeorgiaGermanyGhanaGreeceGrenadaGuatemalaGuineaGuinea-BissauGuyanaHaitiHeavily indebted poor countries (HIPC)High incomeHondurasHong Kong SAR, ChinaHungaryIBRD onlyIcelandIDA & IBRD totalIDA blendIDA onlyIDA totalIndiaIndonesiaIran, Islamic Rep.IraqIrelandIsraelItalyJamaicaJapanJordanKazakhstanKenyaKiribatiKorea, Rep.KosovoKuwaitKyrgyz RepublicLao PDRLate-demographic dividendLatin America & Caribbean Latin America & Caribbean (excluding high income)Latin America & the Caribbean (IDA & IBRD countries)LatviaLeast developed countries: UN classificationLebanonLesothoLiberiaLibyaLithuaniaLow & middle incomeLow incomeLower middle incomeLuxembourgMacao SAR, ChinaMacedonia, FYRMadagascarMalawiMalaysiaMaldivesMaliMaltaMauritaniaMauritiusMexicoMicronesia, Fed. Sts.Middle East & North AfricaMiddle East & North Africa (excluding high income)Middle East & North Africa (IDA & IBRD countries)Middle incomeMoldovaMongoliaMontenegroMoroccoMozambiqueNamibiaNepalNetherlandsNew CaledoniaNew ZealandNicaraguaNigerNigeriaNorth AmericaNorwayOECD membersOmanPacific island small statesPakistanPanamaPapua New GuineaParaguayPeruPhilippinesPolandPortugalPost-demographic dividendPre-demographic dividendPuerto RicoRomaniaRussian FederationRwandaSaudi ArabiaSenegalSerbiaSeychellesSierra LeoneSingaporeSlovak RepublicSloveniaSolomon IslandsSomaliaSouth AfricaSouth AsiaSouth Asia (IDA & IBRD)South SudanSpainSri LankaSt. Kitts and NevisSt. LuciaSt. Vincent and the GrenadinesSub-Saharan Africa Sub-Saharan Africa (excluding high income)Sub-Saharan Africa (IDA & IBRD countries)SudanSurinameSwazilandSwedenSwitzerlandSyrian Arab RepublicTajikistanTanzaniaThailandTimor-LesteTogoTongaTrinidad and TobagoTunisiaTurkeyTurkmenistanUgandaUkraineUnited Arab EmiratesUnited KingdomUnited StatesUpper middle incomeUruguayUzbekistanVanuatuVenezuela, RBVietnamWest Bank and GazaWorldYemen, Rep.ZambiaZimbabwe Timeline:
This timeline shows a graph from 1961 to 2016 of India. No data until 1960. Number of actual observations by date: 56.
Source name:
World Development Indicators
Source organization:
World Bank national accounts data, and OECD National Accounts data files.
Categories, topics:
Economy & Growth
Last updated:
apr 23, 2017
Indicators value changes by year
Minimum:
12.763
jan 1, 1961
At the date of observation
Value
Absolute change
Change from previous value
jan 1, 1961
12.763
+12.763
0.0%
jan 1, 1962
13.435
+0.672
5.27%
jan 1, 1963
13.912
+0.476
3.55%
jan 1, 1964
14.38
+0.469
3.37%
jan 1, 1965
14.514
+0.133
0.93%
jan 1, 1966
15.317
+0.803
5.53%
jan 1, 1967
14.895
-0.422
-2.75%
jan 1, 1968
14.101
-0.794
-5.33%
jan 1, 1969
14.001
-0.1
-0.71%
jan 1, 1970
13.882
-0.119
-0.85%
jan 1, 1971
13.619
-0.263
-1.89%
jan 1, 1972
14.665
+1.046
7.68%
jan 1, 1973
15.085
+0.42
2.86%
jan 1, 1974
14.141
-0.945
-6.26%
jan 1, 1975
14.956
+0.815
5.77%
jan 1, 1976
16.025
+1.069
7.15%
jan 1, 1977
16.641
+0.615
3.84%
jan 1, 1978
16.85
+0.209
1.26%
jan 1, 1979
17.2
+0.35
2.08%
jan 1, 1980
17.947
+0.747
4.34%
jan 1, 1981
17.919
-0.027
-0.15%
jan 1, 1982
18.572
+0.652
3.64%
jan 1, 1983
19.785
+1.213
6.53%
jan 1, 1984
19.214
-0.57
-2.88%
jan 1, 1985
19.66
+0.445
2.32%
jan 1, 1986
20.599
+0.94
4.78%
jan 1, 1987
21.447
+0.847
4.11%
jan 1, 1988
22.054
+0.607
2.83%
jan 1, 1989
21.886
-0.168
-0.76%
jan 1, 1990
22.711
+0.825
3.77%
jan 1, 1991
23.825
+1.114
4.9%
jan 1, 1992
22.625
-1.199
-5.03%
jan 1, 1993
22.972
+0.347
1.53%
jan 1, 1994
21.479
-1.493
-6.5%
jan 1, 1995
21.848
+0.369
1.72%
jan 1, 1996
24.052
+2.203
10.09%
jan 1, 1997
23.114
-0.938
-3.9%
jan 1, 1998
23.684
+0.57
2.47%
jan 1, 1999
23.682
-0.002
-0.01%
jan 1, 2000
23.956
+0.275
1.16%
jan 1, 2001
22.742
-1.214
-5.07%
jan 1, 2002
25.054
+2.312
10.17%
jan 1, 2003
23.7
-1.354
-5.4%
jan 1, 2004
24.546
+0.846
3.57%
jan 1, 2005
28.716
+4.17
16.99%
jan 1, 2006
30.333
+1.617
5.63%
jan 1, 2007
31.289
+0.957
3.15%
jan 1, 2008
35.57
+4.281
13.68%
jan 1, 2009
34.952
-0.619
-1.74%
jan 1, 2010
34.292
-0.66
-1.89%
jan 1, 2011
33.414
-0.878
-2.56%
jan 1, 2012
34.313
+0.899
2.69%
jan 1, 2013
33.377
-0.937
-2.73%
jan 1, 2014
31.619
-1.758
-5.27%
jan 1, 2015
30.784
-0.835
-2.64%
jan 1, 2016
29.26
-1.524
-4.95%
Ranking of countries by current statistics by years


Comments: