29
/
en
AIzaSyAYiBZKx7MnpbEhh9jyipgxe19OcubqV5w
April 1, 2024
248772
Sri Lanka
LKA
true
2
1
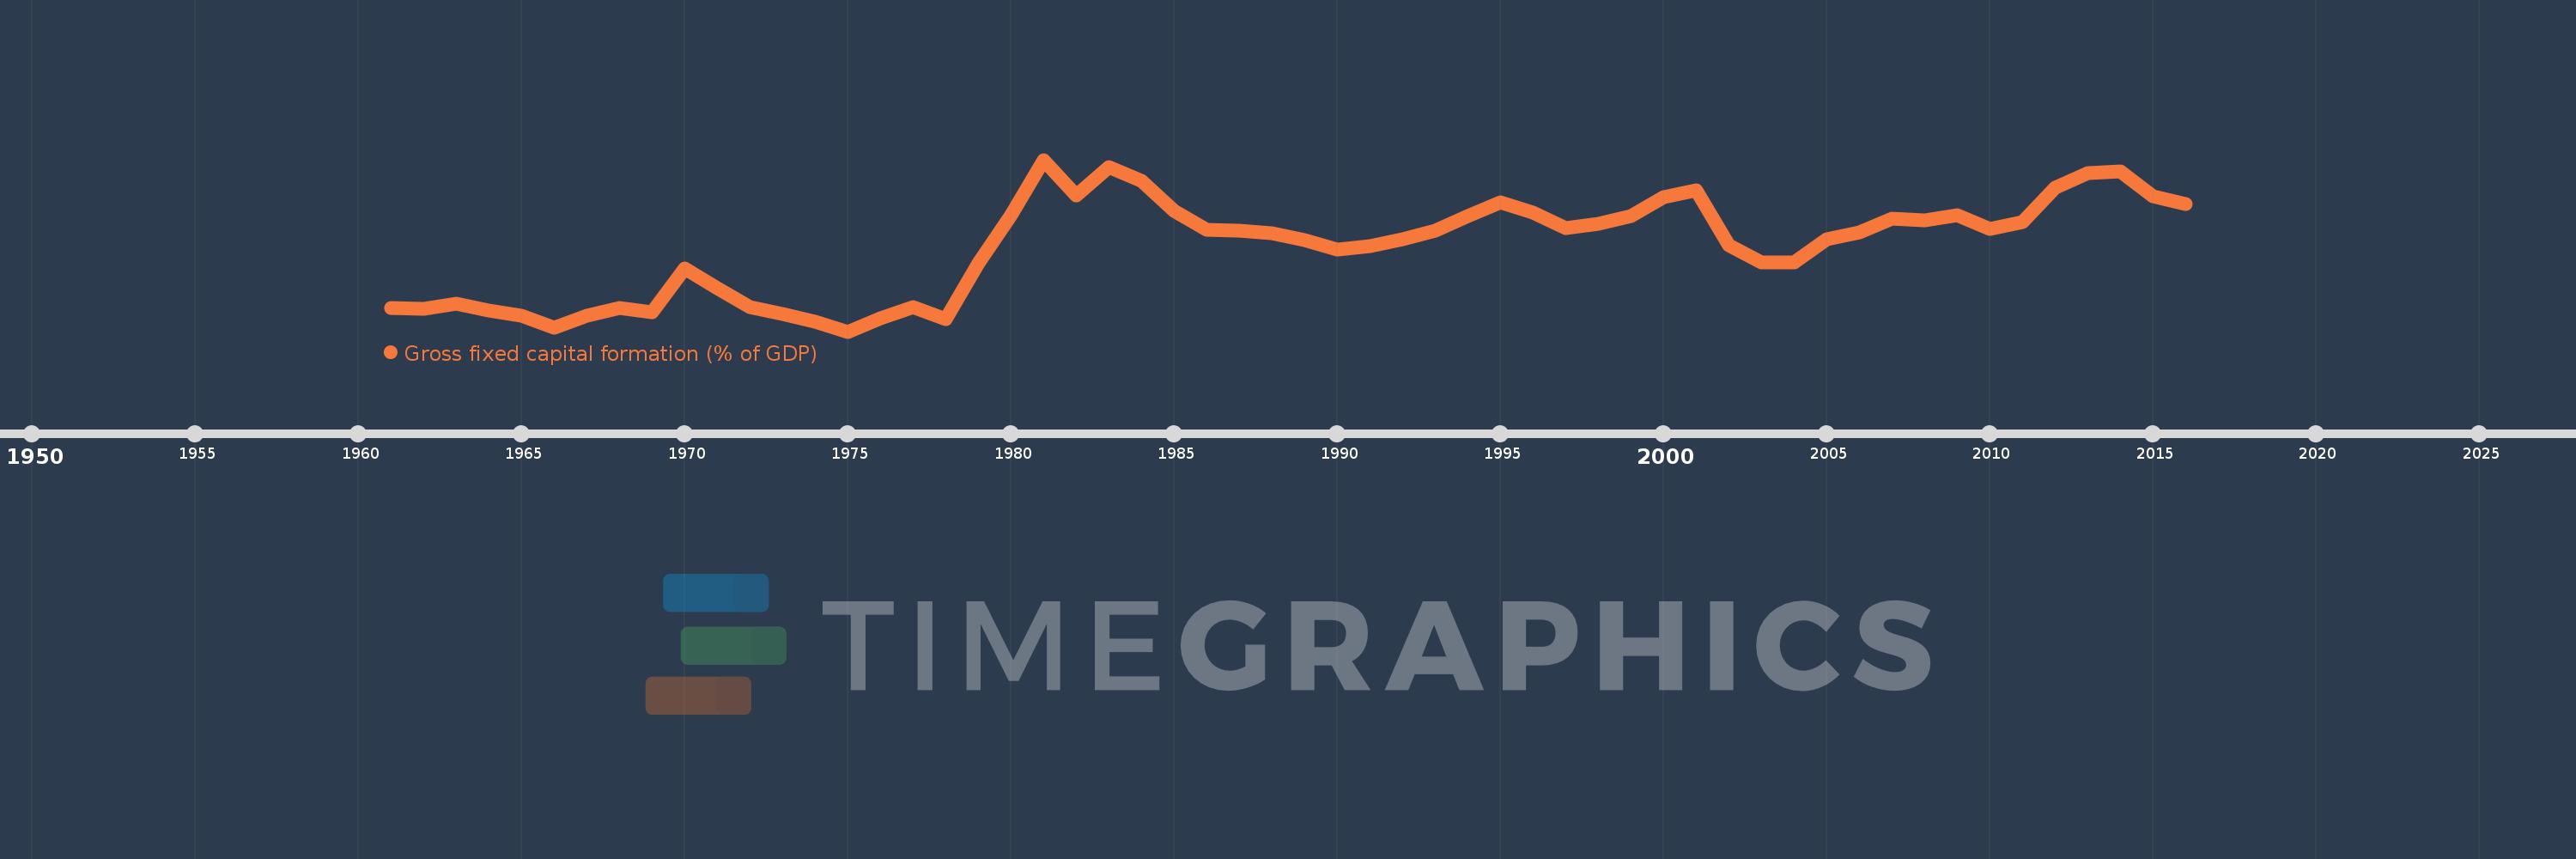
Gross fixed capital formation (% of GDP)
2016,2015,2014,2013,2012,2011,2010,2009,2008,2007,2006,2005,2004,2003,2002,2001,2000,1999,1998,1997,1996,1995,1994,1993,1992,1991,1990,1989,1988,1987,1986,1985,1984,1983,1982,1981,1980,1979,1978,1977,1976,1975,1974,1973,1972,1971,1970,1969,1968,1967,1966,1965,1964,1963,1962,1961
This statistics in other country:
AfghanistanAlbaniaAlgeriaAngolaAntigua and BarbudaArab WorldArgentinaArmeniaArubaAustraliaAustriaAzerbaijanBahamas, TheBahrainBangladeshBarbadosBelarusBelgiumBelizeBeninBermudaBhutanBoliviaBosnia and HerzegovinaBotswanaBrazilBrunei DarussalamBulgariaBurkina FasoBurundiCabo VerdeCambodiaCameroonCanadaCaribbean small statesCentral African RepublicCentral Europe and the BalticsChadChileChinaColombiaComorosCongo, Dem. Rep.Congo, Rep.Costa RicaCote d'IvoireCroatiaCubaCyprusCzech RepublicDenmarkDjiboutiDominicaDominican RepublicEarly-demographic dividendEast Asia & PacificEast Asia & Pacific (excluding high income)East Asia & Pacific (IDA & IBRD countries)EcuadorEgypt, Arab Rep.El SalvadorEquatorial GuineaEritreaEstoniaEthiopiaEuro areaEurope & Central AsiaEurope & Central Asia (excluding high income)Europe & Central Asia (IDA & IBRD countries)European UnionFijiFinlandFragile and conflict affected situationsFranceGabonGambia, TheGeorgiaGermanyGhanaGreeceGrenadaGuatemalaGuineaGuinea-BissauGuyanaHaitiHeavily indebted poor countries (HIPC)High incomeHondurasHong Kong SAR, ChinaHungaryIBRD onlyIcelandIDA & IBRD totalIDA blendIDA onlyIDA totalIndiaIndonesiaIran, Islamic Rep.IraqIrelandIsraelItalyJamaicaJapanJordanKazakhstanKenyaKiribatiKorea, Rep.KosovoKuwaitKyrgyz RepublicLao PDRLate-demographic dividendLatin America & Caribbean Latin America & Caribbean (excluding high income)Latin America & the Caribbean (IDA & IBRD countries)LatviaLeast developed countries: UN classificationLebanonLesothoLiberiaLibyaLithuaniaLow & middle incomeLow incomeLower middle incomeLuxembourgMacao SAR, ChinaMacedonia, FYRMadagascarMalawiMalaysiaMaldivesMaliMaltaMauritaniaMauritiusMexicoMicronesia, Fed. Sts.Middle East & North AfricaMiddle East & North Africa (excluding high income)Middle East & North Africa (IDA & IBRD countries)Middle incomeMoldovaMongoliaMontenegroMoroccoMozambiqueNamibiaNepalNetherlandsNew CaledoniaNew ZealandNicaraguaNigerNigeriaNorth AmericaNorwayOECD membersOmanPacific island small statesPakistanPanamaPapua New GuineaParaguayPeruPhilippinesPolandPortugalPost-demographic dividendPre-demographic dividendPuerto RicoRomaniaRussian FederationRwandaSaudi ArabiaSenegalSerbiaSeychellesSierra LeoneSingaporeSlovak RepublicSloveniaSolomon IslandsSomaliaSouth AfricaSouth AsiaSouth Asia (IDA & IBRD)South SudanSpainSri LankaSt. Kitts and NevisSt. LuciaSt. Vincent and the GrenadinesSub-Saharan Africa Sub-Saharan Africa (excluding high income)Sub-Saharan Africa (IDA & IBRD countries)SudanSurinameSwazilandSwedenSwitzerlandSyrian Arab RepublicTajikistanTanzaniaThailandTimor-LesteTogoTongaTrinidad and TobagoTunisiaTurkeyTurkmenistanUgandaUkraineUnited Arab EmiratesUnited KingdomUnited StatesUpper middle incomeUruguayUzbekistanVanuatuVenezuela, RBVietnamWest Bank and GazaWorldYemen, Rep.ZambiaZimbabwe Timeline:
This timeline shows a graph from 1961 to 2016 of Sri Lanka. No data until 1960. Number of actual observations by date: 56.
Source name:
World Development Indicators
Source organization:
World Bank national accounts data, and OECD National Accounts data files.
Categories, topics:
Economy & Growth
Last updated:
apr 23, 2017
Indicators value changes by year
Minimum:
12.503
jan 1, 1975
Maximum:
31.333
jan 1, 1981
At the date of observation
Value
Absolute change
Change from previous value
jan 1, 1961
15.124
+15.124
0.0%
jan 1, 1962
14.98
-0.144
-0.95%
jan 1, 1963
15.531
+0.552
3.68%
jan 1, 1964
14.838
-0.693
-4.46%
jan 1, 1965
14.24
-0.598
-4.03%
jan 1, 1966
12.902
-1.338
-9.4%
jan 1, 1967
14.238
+1.336
10.35%
jan 1, 1968
15.116
+0.878
6.17%
jan 1, 1969
14.631
-0.485
-3.21%
jan 1, 1970
19.461
+4.83
33.01%
jan 1, 1971
17.264
-2.197
-11.29%
jan 1, 1972
15.231
-2.033
-11.78%
jan 1, 1973
14.468
-0.763
-5.01%
jan 1, 1974
13.546
-0.922
-6.38%
jan 1, 1975
12.503
-1.043
-7.7%
jan 1, 1976
13.918
+1.415
11.32%
jan 1, 1977
15.214
+1.296
9.31%
jan 1, 1978
13.83
-1.384
-9.1%
jan 1, 1979
19.972
+6.142
44.41%
jan 1, 1980
25.285
+5.313
26.6%
jan 1, 1981
31.333
+6.048
23.92%
jan 1, 1982
27.385
-3.948
-12.6%
jan 1, 1983
30.511
+3.126
11.42%
jan 1, 1984
29.064
-1.448
-4.74%
jan 1, 1985
25.729
-3.334
-11.47%
jan 1, 1986
23.684
-2.045
-7.95%
jan 1, 1987
23.583
-0.101
-0.43%
jan 1, 1988
23.257
-0.326
-1.38%
jan 1, 1989
22.507
-0.75
-3.23%
jan 1, 1990
21.537
-0.97
-4.31%
jan 1, 1991
21.883
+0.347
1.61%
jan 1, 1992
22.615
+0.732
3.34%
jan 1, 1993
23.523
+0.908
4.01%
jan 1, 1994
25.197
+1.674
7.12%
jan 1, 1995
26.639
+1.442
5.72%
jan 1, 1996
25.589
-1.05
-3.94%
jan 1, 1997
23.89
-1.698
-6.64%
jan 1, 1998
24.36
+0.47
1.97%
jan 1, 1999
25.12
+0.759
3.12%
jan 1, 2000
27.282
+2.162
8.61%
jan 1, 2001
28.036
+0.754
2.76%
jan 1, 2002
22.001
-6.035
-21.53%
jan 1, 2003
20.073
-1.928
-8.76%
jan 1, 2004
20.038
-0.035
-0.17%
jan 1, 2005
22.638
+2.599
12.97%
jan 1, 2006
23.372
+0.734
3.24%
jan 1, 2007
24.872
+1.5
6.42%
jan 1, 2008
24.721
-0.151
-0.61%
jan 1, 2009
25.287
+0.566
2.29%
jan 1, 2010
23.731
-1.556
-6.15%
jan 1, 2011
24.464
+0.734
3.09%
jan 1, 2012
28.239
+3.775
15.43%
jan 1, 2013
29.892
+1.652
5.85%
jan 1, 2014
30.069
+0.177
0.59%
jan 1, 2015
27.309
-2.76
-9.18%
jan 1, 2016
26.523
-0.785
-2.88%
Ranking of countries by current statistics by years


Comments: