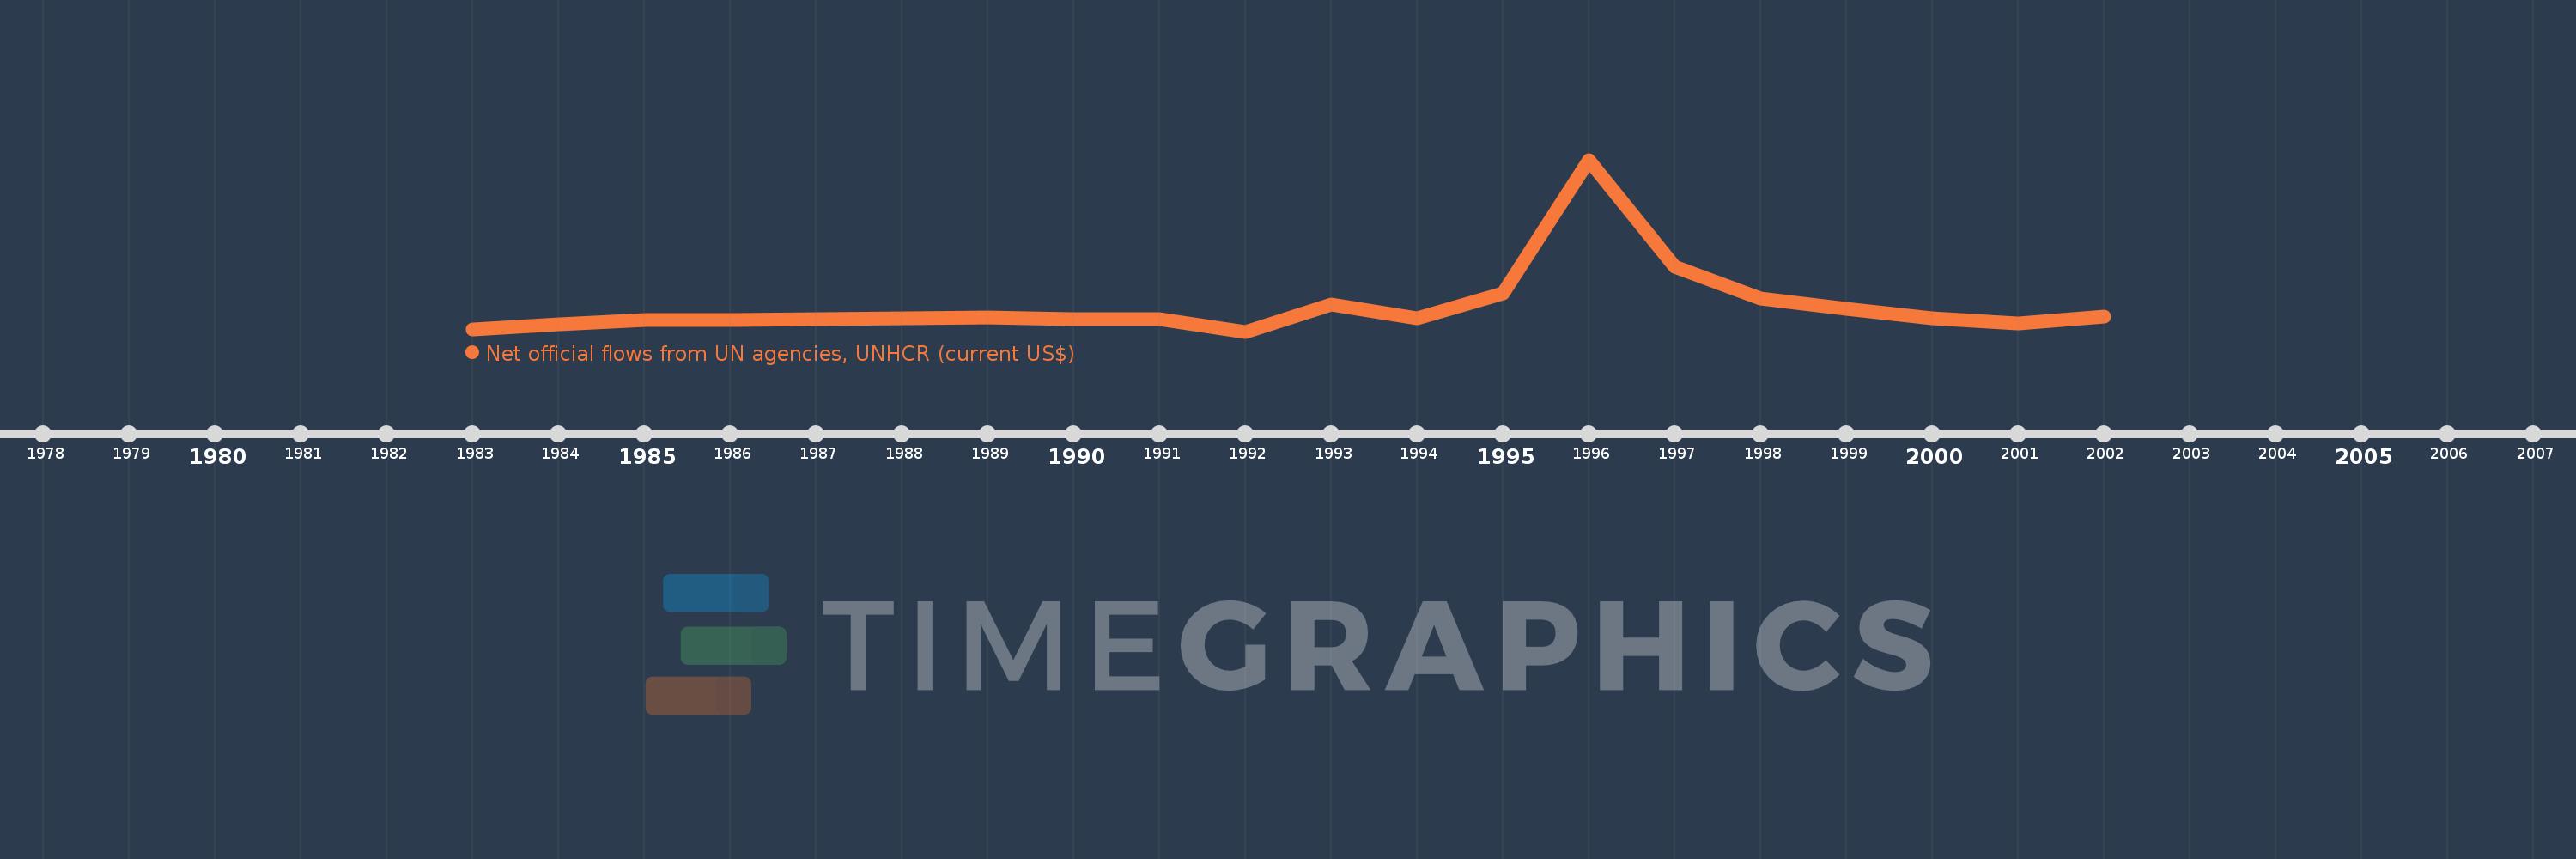
This timeline shows a graph from 1983 to 2002 of Burkina Faso. No data until 1982. Number of actual observations by date: 19.
Source name:
World Development Indicators
Source organization:
Development Assistance Committee of the Organisation for Economic Co-operation and Development, Geographical Distribution of Financial Flows to Developing Countries, Development Co-operation Report, and International Development Statistics database. Data are available online at: www.oecd.org/dac/stats/idsonline.
Categories, topics:
Aid Effectiveness
Last updated:
apr 23, 2017
Indicators value changes by year
Meaning:
419.474K
Minimum:
100.0K
jan 1, 1992
Maximum:
2.23 mln
jan 1, 1996
At the date of observation
Value
Absolute change
Change from the previous value
jan 1, 1983
130.0K
+130.0K
0.0%
jan 1, 1984
190.0K
+60.0K
46.15%
jan 1, 1985
240.0K
+50.0K
26.32%
jan 1, 1986
240.0K
0.0
0.0%
jan 1, 1987
250.0K
+10.0K
4.17%
jan 1, 1989
280.0K
+30.0K
12.0%
jan 1, 1990
250.0K
-30.0K
-10.71%
jan 1, 1991
250.0K
0.0
0.0%
jan 1, 1992
100.0K
-150.0K
-60.0%
jan 1, 1993
440.0K
+340.0K
340.0%
jan 1, 1994
260.0K
-180.0K
-40.91%
jan 1, 1995
570.0K
+310.0K
119.23%
jan 1, 1996
2.23 mln
+1.66 mln
291.23%
jan 1, 1997
900.0K
-1.33 mln
-59.64%
jan 1, 1998
510.0K
-390.0K
-43.33%
jan 1, 1999
380.0K
-130.0K
-25.49%
jan 1, 2000
260.0K
-120.0K
-31.58%
jan 1, 2001
200.0K
-60.0K
-23.08%
jan 1, 2002
290.0K
+90.0K
45.0%
Ranking of countries by current statistics by years