29
/
en
AIzaSyAYiBZKx7MnpbEhh9jyipgxe19OcubqV5w
April 1, 2024
137112
Gambia, The
GMB
true
2
1
Net official flows from UN agencies, UNHCR (current US$)
2014,2010,2009,2008,2007,2006,2005,2004,2003,2002,2001,2000,1999,1998,1997,1996,1995,1994,1982,1981,1980
Download
Global statistics library →Gambia, The →

Net official flows from UN agencies, UNHCR (current US$)

This statistics in other country:
AfghanistanAlbaniaAlgeriaAngolaArab WorldArgentinaArmeniaAzerbaijanBahrainBangladeshBelarusBelizeBeninBoliviaBosnia and HerzegovinaBotswanaBrazilBulgariaBurkina FasoBurundiCabo VerdeCambodiaCameroonCaribbean small statesCentral African RepublicCentral Europe and the BalticsChadChileChinaColombiaComorosCongo, Dem. Rep.Congo, Rep.Costa RicaCote d'IvoireCroatiaCubaCyprusCzech RepublicDjiboutiDominican RepublicEast Asia & PacificEast Asia & Pacific (excluding high income)East Asia & Pacific (IDA & IBRD countries)EcuadorEgypt, Arab Rep.El SalvadorEquatorial GuineaEritreaEthiopiaEuro areaEurope & Central AsiaEurope & Central Asia (excluding high income)Europe & Central Asia (IDA & IBRD countries)European UnionFragile and conflict affected situationsGabonGambia, TheGeorgiaGhanaGuatemalaGuineaGuinea-BissauHaitiHeavily indebted poor countries (HIPC)High incomeHondurasHong Kong SAR, ChinaHungaryIBRD onlyIDA & IBRD totalIDA blendIDA onlyIDA totalIndiaIndonesiaIran, Islamic Rep.IraqIsraelJamaicaJordanKazakhstanKenyaKorea, Dem. People’s Rep.Korea, Rep.KosovoKuwaitKyrgyz RepublicLao PDRLatin America & Caribbean Latin America & Caribbean (excluding high income)Latin America & the Caribbean (IDA & IBRD countries)LatviaLeast developed countries: UN classificationLebanonLesothoLiberiaLibyaLow & middle incomeLow incomeLower middle incomeMacao SAR, ChinaMacedonia, FYRMadagascarMalawiMalaysiaMaliMaltaMauritaniaMexicoMiddle East & North AfricaMiddle East & North Africa (excluding high income)Middle East & North Africa (IDA & IBRD countries)Middle incomeMoldovaMongoliaMontenegroMoroccoMozambiqueMyanmarNamibiaNepalNicaraguaNigerNigeriaOECD membersOther small statesPakistanPanamaPapua New GuineaParaguayPeruPhilippinesPolandRomaniaRussian FederationRwandaSao Tome and PrincipeSaudi ArabiaSenegalSerbiaSierra LeoneSingaporeSlovak RepublicSloveniaSmall statesSomaliaSouth AfricaSouth AsiaSouth Asia (IDA & IBRD)South SudanSri LankaSub-Saharan Africa Sub-Saharan Africa (excluding high income)Sub-Saharan Africa (IDA & IBRD countries)SudanSurinameSwazilandSyrian Arab RepublicTajikistanTanzaniaThailandTimor-LesteTogoTunisiaTurkeyTurkmenistanUgandaUkraineUnited Arab EmiratesUpper middle incomeUruguayUzbekistanVenezuela, RBVietnamWorldYemen, Rep.ZambiaZimbabwe
Timeline:
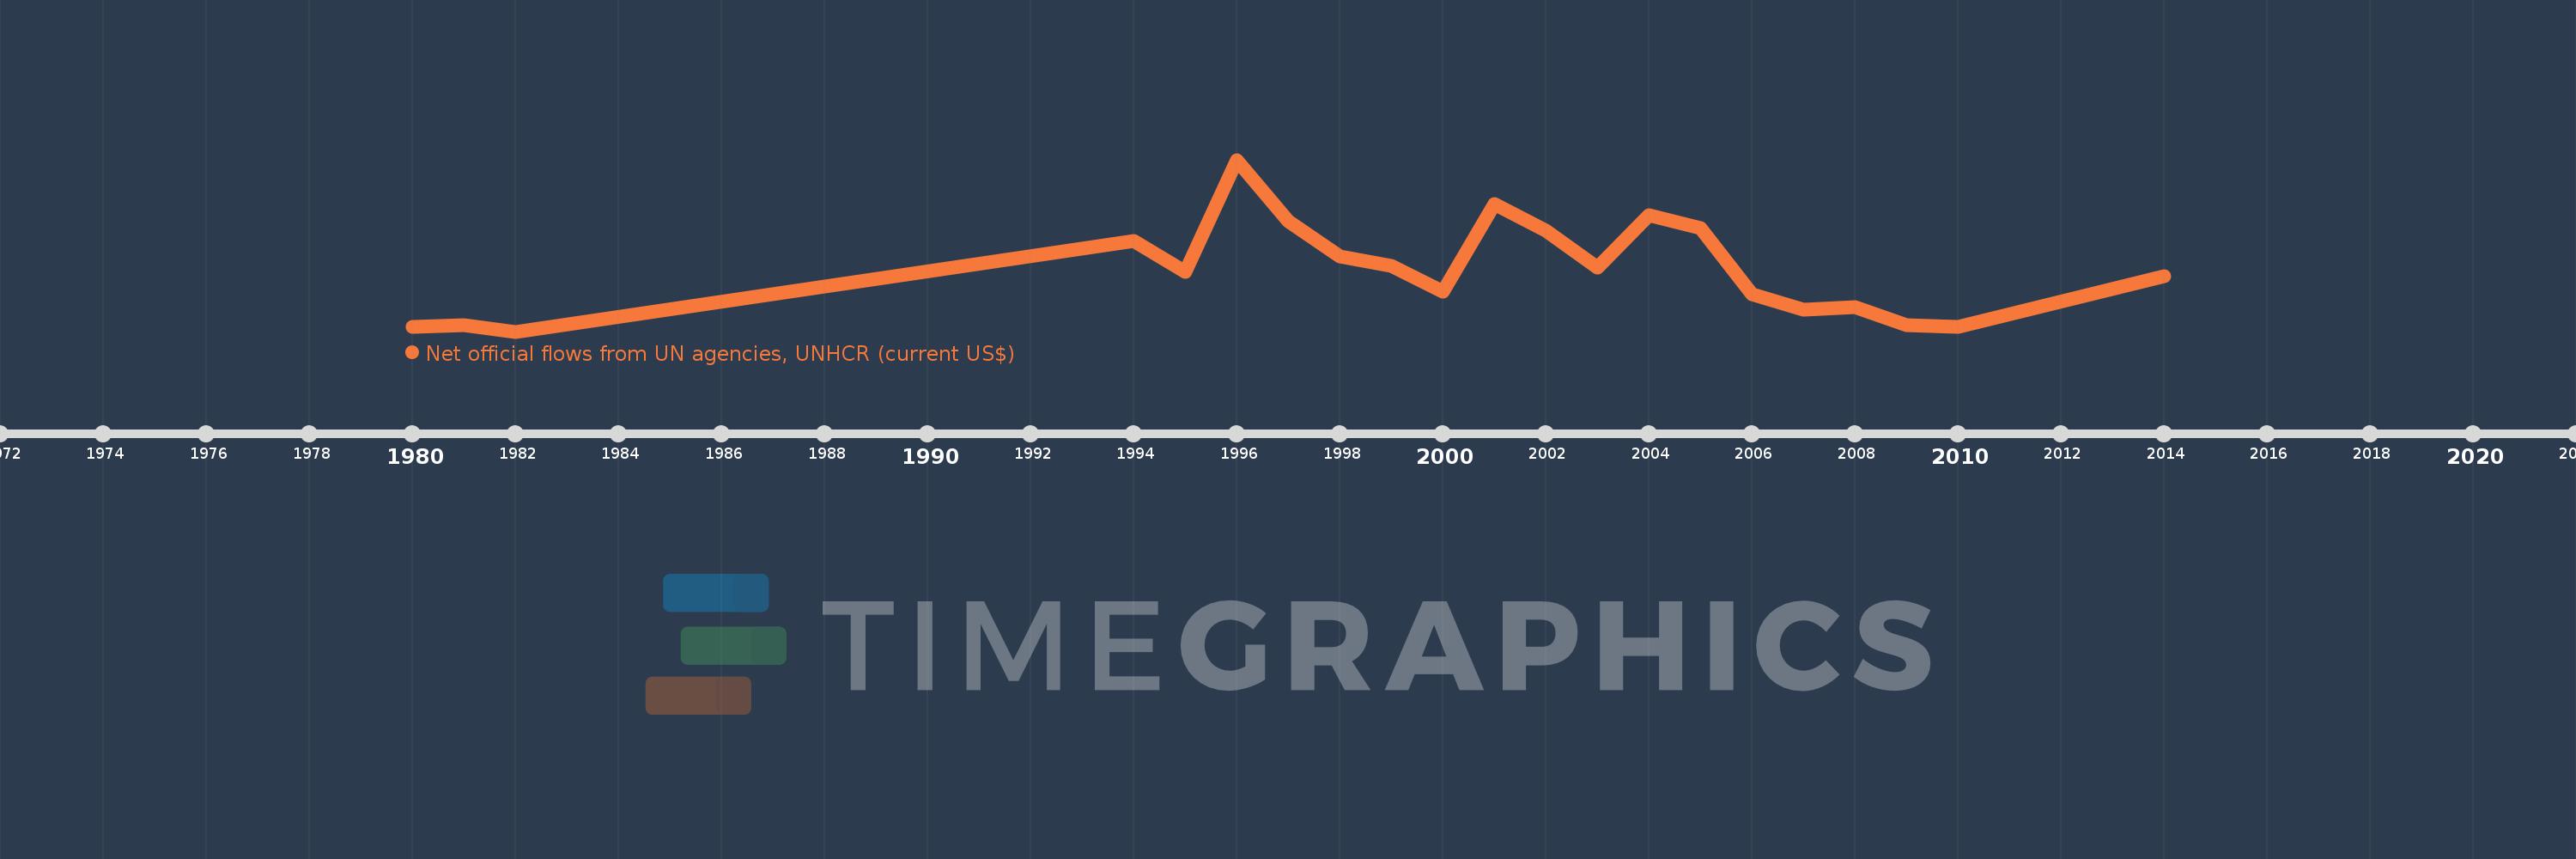
This timeline shows a graph from 1980 to 2014 of Gambia, The. No data until 1979. Number of actual observations by date: 21.
Source name:
World Development Indicators
Source organization:
Development Assistance Committee of the Organisation for Economic Co-operation and Development, Geographical Distribution of Financial Flows to Developing Countries, Development Co-operation Report, and International Development Statistics database. Data are available online at: www.oecd.org/dac/stats/idsonline.
Categories, topics:
Aid Effectiveness
Last updated:
apr 23, 2017
Indicators value changes by year
Mean:
288.095K
Minimum:
10.0K
jan 1, 1982
Maximum:
790.0K
jan 1, 1996
At the date of observation
Value
Absolute change
Change from previous value
jan 1, 1980
30.0K
+30.0K
0.0%
jan 1, 1981
40.0K
+10.0K
33.33%
jan 1, 1982
10.0K
-30.0K
-75.0%
jan 1, 1994
420.0K
+410.0K
4.1K%
jan 1, 1995
280.0K
-140.0K
-33.33%
jan 1, 1996
790.0K
+510.0K
182.14%
jan 1, 1997
510.0K
-280.0K
-35.44%
jan 1, 1998
350.0K
-160.0K
-31.37%
jan 1, 1999
310.0K
-40.0K
-11.43%
jan 1, 2000
190.0K
-120.0K
-38.71%
jan 1, 2001
590.0K
+400.0K
210.53%
jan 1, 2002
470.0K
-120.0K
-20.34%
jan 1, 2003
300.0K
-170.0K
-36.17%
jan 1, 2004
540.0K
+240.0K
80.0%
jan 1, 2005
480.0K
-60.0K
-11.11%
jan 1, 2006
180.0K
-300.0K
-62.5%
jan 1, 2007
110.0K
-70.0K
-38.89%
jan 1, 2008
120.0K
+10.0K
9.09%
jan 1, 2009
40.0K
-80.0K
-66.67%
jan 1, 2010
30.0K
-10.0K
-25.0%
jan 1, 2014
260.0K
+230.0K
766.67%
Ranking of countries by current statistics by years

Comments:

Send
PremiumAbout & FeedbackTermsPrivacy
logo
© 2022 Selected Technologies LLC – Morgan Hill, California