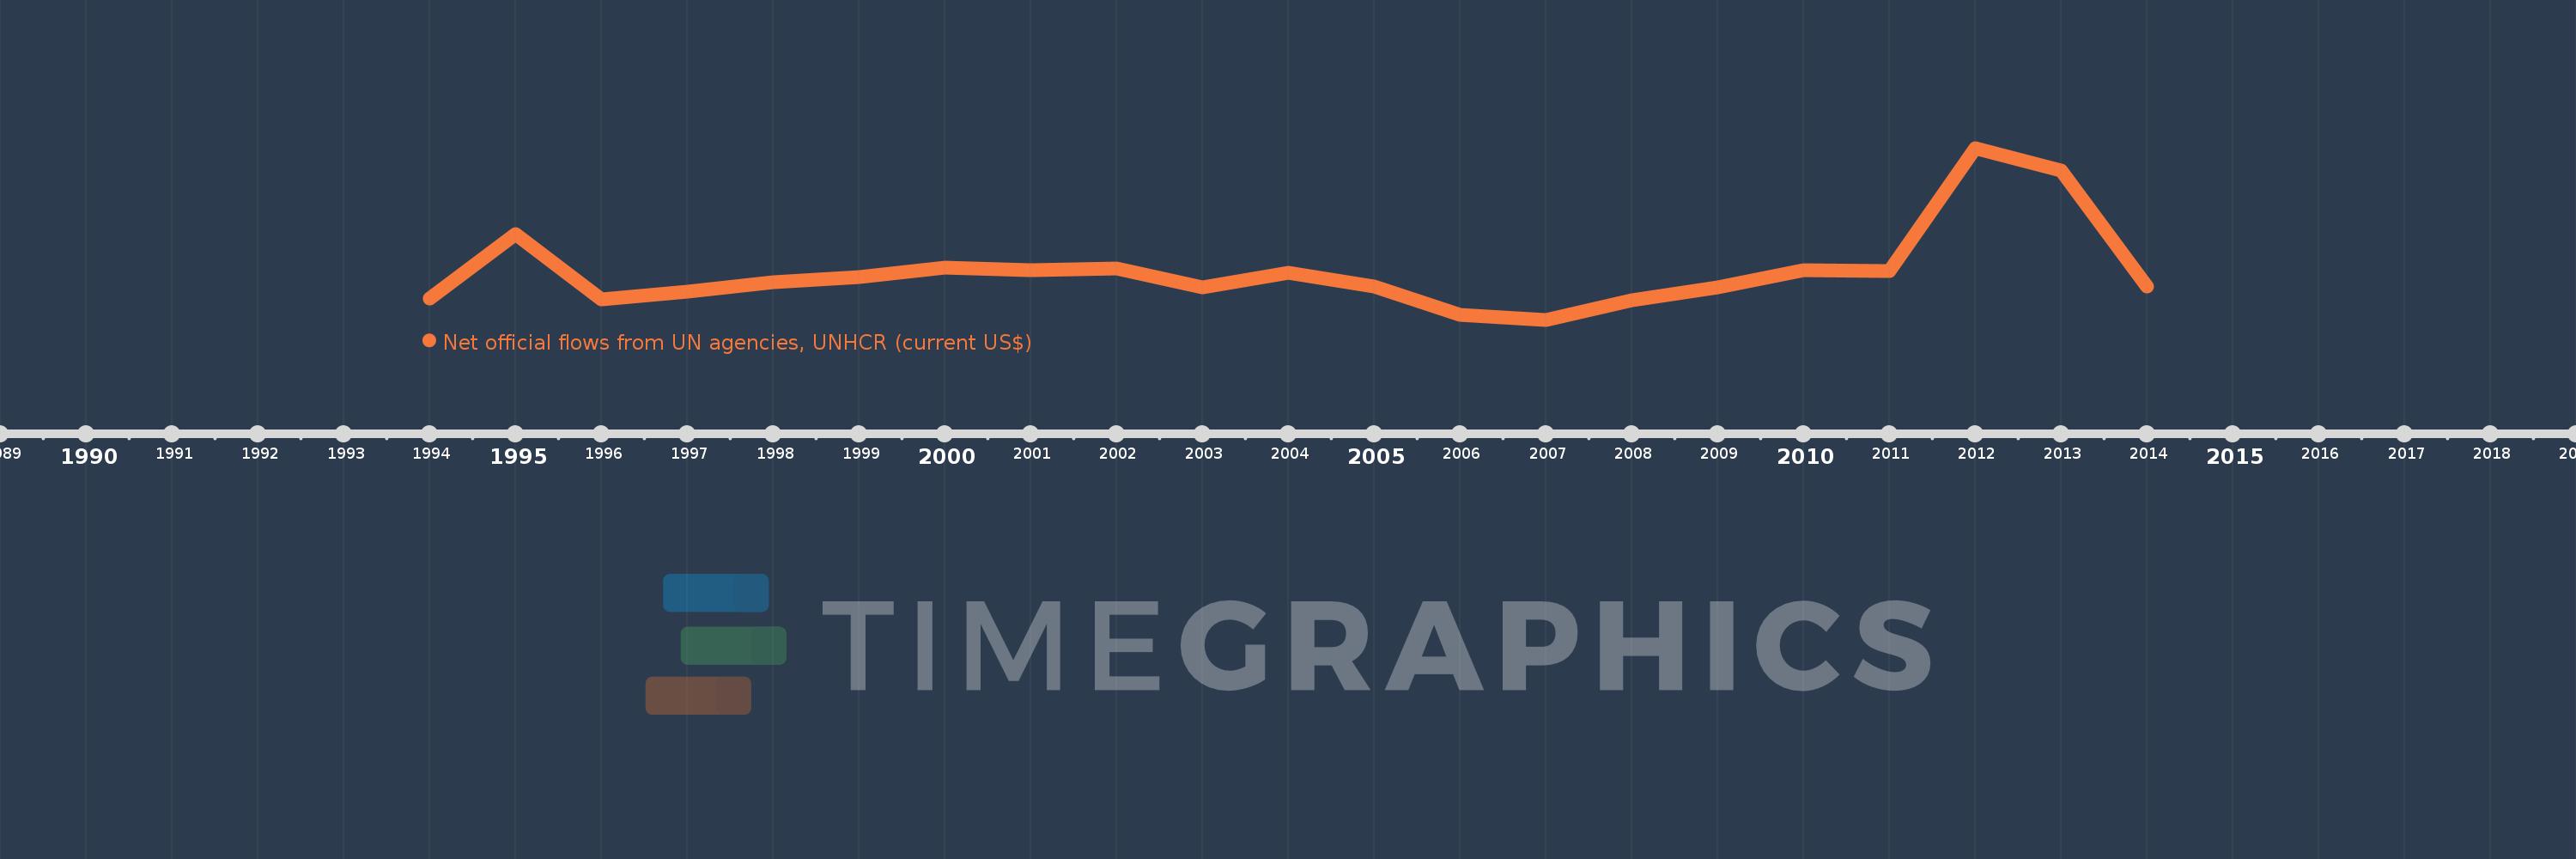
This timeline shows a graph from 1994 to 2014 of South Africa. No data until 1993. Number of actual observations by date: 21.
Source name:
World Development Indicators
Source organization:
Development Assistance Committee of the Organisation for Economic Co-operation and Development, Geographical Distribution of Financial Flows to Developing Countries, Development Co-operation Report, and International Development Statistics database. Data are available online at: www.oecd.org/dac/stats/idsonline.
Categories, topics:
Aid Effectiveness
Last updated:
apr 23, 2017
Indicators value changes by year
Meaning:
3.613 mln
Minimum:
640.0K
jan 1, 2007
Maximum:
11.26 mln
jan 1, 2012
At the date of observation
Value
Absolute change
Change from the previous value
jan 1, 1994
1.94 mln
+1.94 mln
0.0%
jan 1, 1995
5.95 mln
+4.01 mln
206.7%
jan 1, 1996
1.88 mln
-4.07 mln
-68.4%
jan 1, 1997
2.35 mln
+470.0K
25.0%
jan 1, 1998
2.94 mln
+590.0K
25.11%
jan 1, 1999
3.27 mln
+330.0K
11.22%
jan 1, 2000
3.87 mln
+600.0K
18.35%
jan 1, 2001
3.72 mln
-150.0K
-3.88%
jan 1, 2002
3.82 mln
+100.0K
2.69%
jan 1, 2003
2.63 mln
-1.19 mln
-31.15%
jan 1, 2004
3.52 mln
+890.0K
33.84%
jan 1, 2005
2.71 mln
-810.0K
-23.01%
jan 1, 2006
940.0K
-1.77 mln
-65.31%
jan 1, 2007
640.0K
-300.0K
-31.91%
jan 1, 2008
1.84 mln
+1.2 mln
187.5%
jan 1, 2009
2.65 mln
+810.0K
44.02%
jan 1, 2010
3.69 mln
+1.04 mln
39.25%
jan 1, 2011
3.66 mln
-30.0K
-0.81%
jan 1, 2012
11.26 mln
+7.6 mln
207.65%
jan 1, 2013
9.89 mln
-1.37 mln
-12.17%
jan 1, 2014
2.71 mln
-7.18 mln
-72.6%
Ranking of countries by current statistics by years