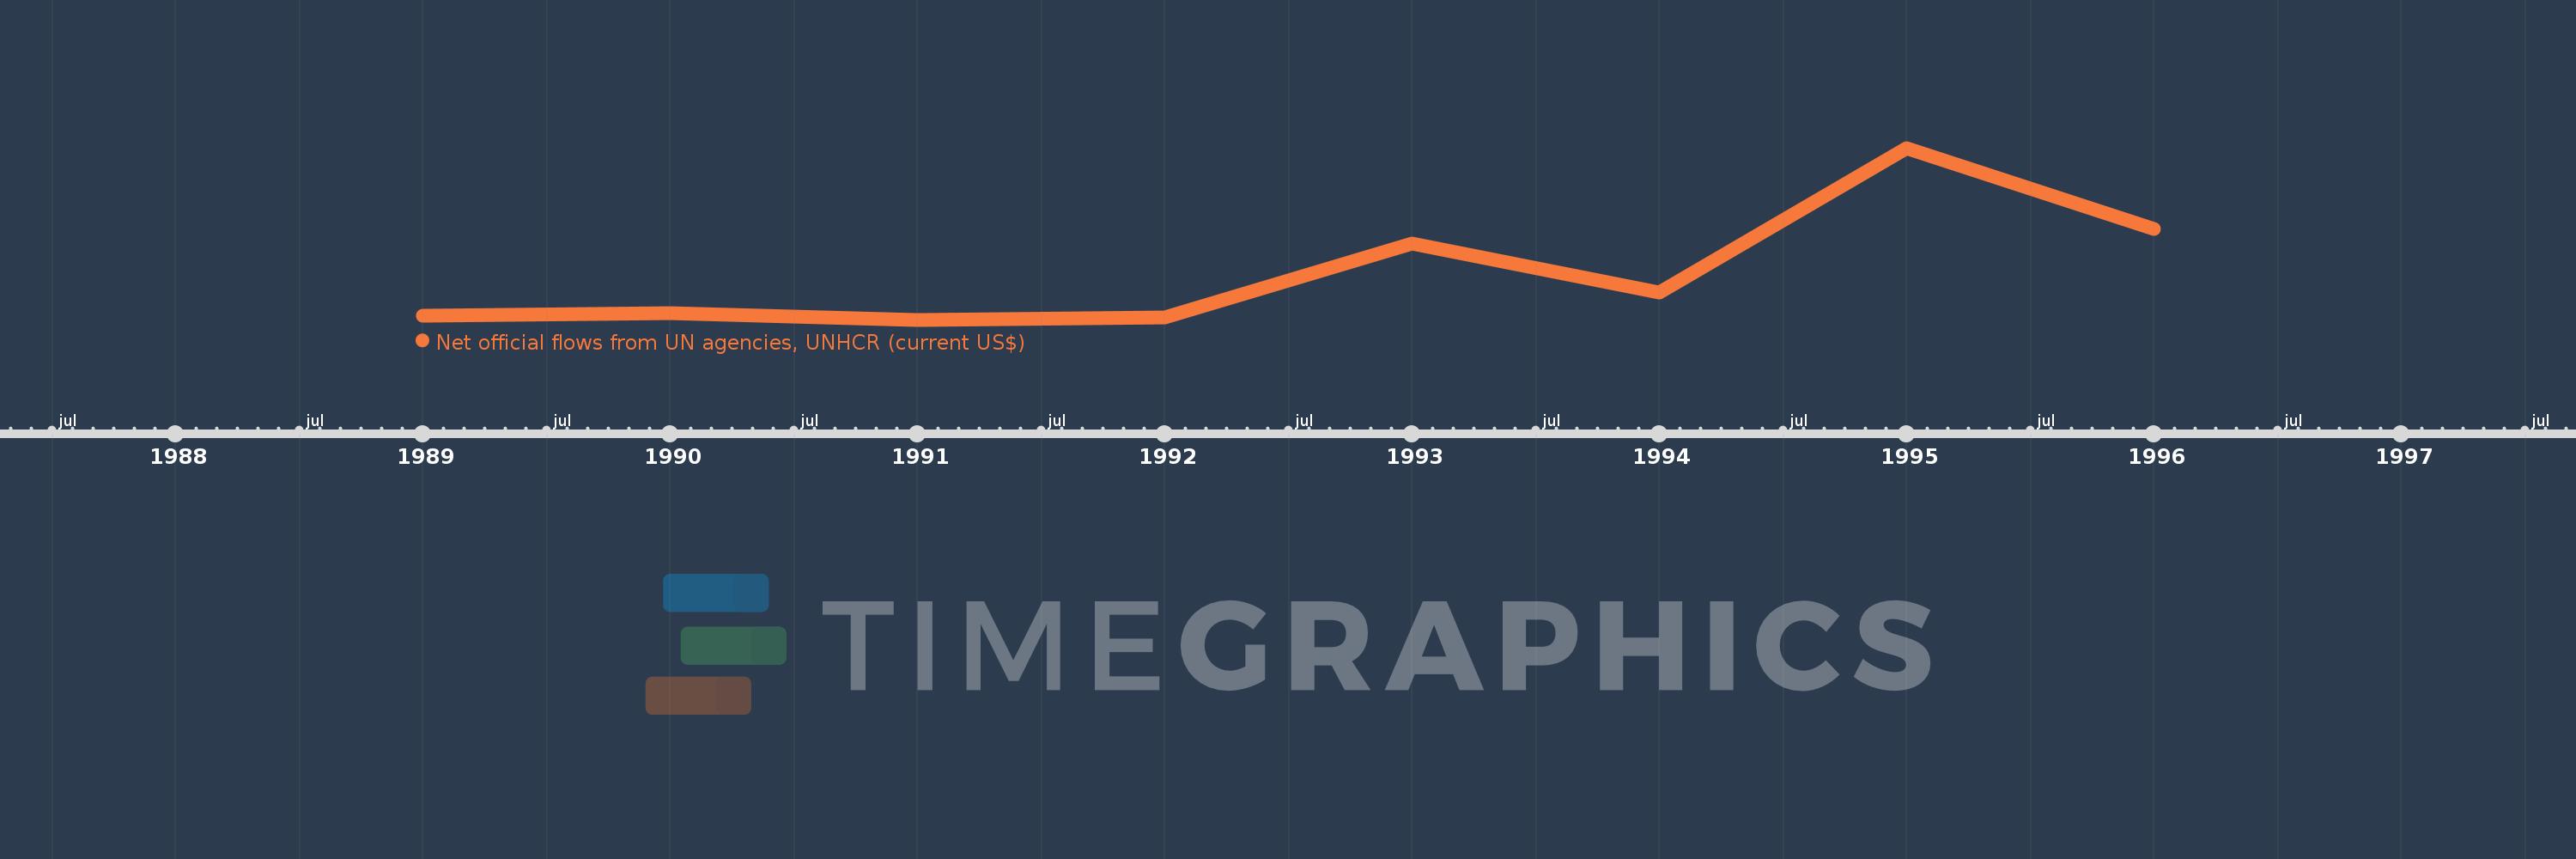
This timeline shows a graph from 1989 to 1996 of Haiti. No data until 1988. Number of actual observations by date: 8.
Source name:
World Development Indicators
Source organization:
Development Assistance Committee of the Organisation for Economic Co-operation and Development, Geographical Distribution of Financial Flows to Developing Countries, Development Co-operation Report, and International Development Statistics database. Data are available online at: www.oecd.org/dac/stats/idsonline.
Categories, topics:
Aid Effectiveness
Last updated:
apr 23, 2017
Indicators value changes by year
Meaning:
353.75K
Minimum:
130.0K
jan 1, 1991
Maximum:
940.0K
jan 1, 1995
At the date of observation
Value
Absolute change
Change from the previous value
jan 1, 1989
150.0K
+150.0K
0.0%
jan 1, 1990
160.0K
+10.0K
6.67%
jan 1, 1991
130.0K
-30.0K
-18.75%
jan 1, 1992
140.0K
+10.0K
7.69%
jan 1, 1993
490.0K
+350.0K
250.0%
jan 1, 1994
260.0K
-230.0K
-46.94%
jan 1, 1995
940.0K
+680.0K
261.54%
jan 1, 1996
560.0K
-380.0K
-40.43%
Ranking of countries by current statistics by years