33
/
AIzaSyAYiBZKx7MnpbEhh9jyipgxe19OcubqV5w
August 1, 2025
237512
Serbia
SRB
true
2
1
Net official flows from UN agencies, UNHCR (current US$)
2014,2013,2012,2011,2010,2009,2008,2007,2005,2002,2001
Download
Global statistics library →Serbia →

Net official flows from UN agencies, UNHCR (current US$)

This statistics in other country:

AfghanistanAlbaniaAlgeriaAngolaArab WorldArgentinaArmeniaAzerbaijanBahrainBangladeshBelarusBelizeBeninBoliviaBosnia and HerzegovinaBotswanaBrazilBulgariaBurkina FasoBurundiCabo VerdeCambodiaCameroonCaribbean small statesCentral African RepublicCentral Europe and the BalticsChadChileChinaColombiaComorosCongo, Dem. Rep.Congo, Rep.Costa RicaCote d'IvoireCroatiaCubaCyprusCzech RepublicDjiboutiDominican RepublicEast Asia & PacificEast Asia & Pacific (excluding high income)East Asia & Pacific (IDA & IBRD countries)EcuadorEgypt, Arab Rep.El SalvadorEquatorial GuineaEritreaEthiopiaEuro areaEurope & Central AsiaEurope & Central Asia (excluding high income)Europe & Central Asia (IDA & IBRD countries)European UnionFragile and conflict affected situationsGabonGambia, TheGeorgiaGhanaGuatemalaGuineaGuinea-BissauHaitiHeavily indebted poor countries (HIPC)High incomeHondurasHong Kong SAR, ChinaHungaryIBRD onlyIDA & IBRD totalIDA blendIDA onlyIDA totalIndiaIndonesiaIran, Islamic Rep.IraqIsraelJamaicaJordanKazakhstanKenyaKorea, Dem. People’s Rep.Korea, Rep.KosovoKuwaitKyrgyz RepublicLao PDRLatin America & Caribbean Latin America & Caribbean (excluding high income)Latin America & the Caribbean (IDA & IBRD countries)LatviaLeast developed countries: UN classificationLebanonLesothoLiberiaLibyaLow & middle incomeLow incomeLower middle incomeMacao SAR, ChinaMacedonia, FYRMadagascarMalawiMalaysiaMaliMaltaMauritaniaMexicoMiddle East & North AfricaMiddle East & North Africa (excluding high income)Middle East & North Africa (IDA & IBRD countries)Middle incomeMoldovaMongoliaMontenegroMoroccoMozambiqueMyanmarNamibiaNepalNicaraguaNigerNigeriaOECD membersOther small statesPakistanPanamaPapua New GuineaParaguayPeruPhilippinesPolandRomaniaRussian FederationRwandaSao Tome and PrincipeSaudi ArabiaSenegalSerbiaSierra LeoneSingaporeSlovak RepublicSloveniaSmall statesSomaliaSouth AfricaSouth AsiaSouth Asia (IDA & IBRD)South SudanSri LankaSub-Saharan Africa Sub-Saharan Africa (excluding high income)Sub-Saharan Africa (IDA & IBRD countries)SudanSurinameSwazilandSyrian Arab RepublicTajikistanTanzaniaThailandTimor-LesteTogoTunisiaTurkeyTurkmenistanUgandaUkraineUnited Arab EmiratesUpper middle incomeUruguayUzbekistanVenezuela, RBVietnamWorldYemen, Rep.ZambiaZimbabwe

Timeline:

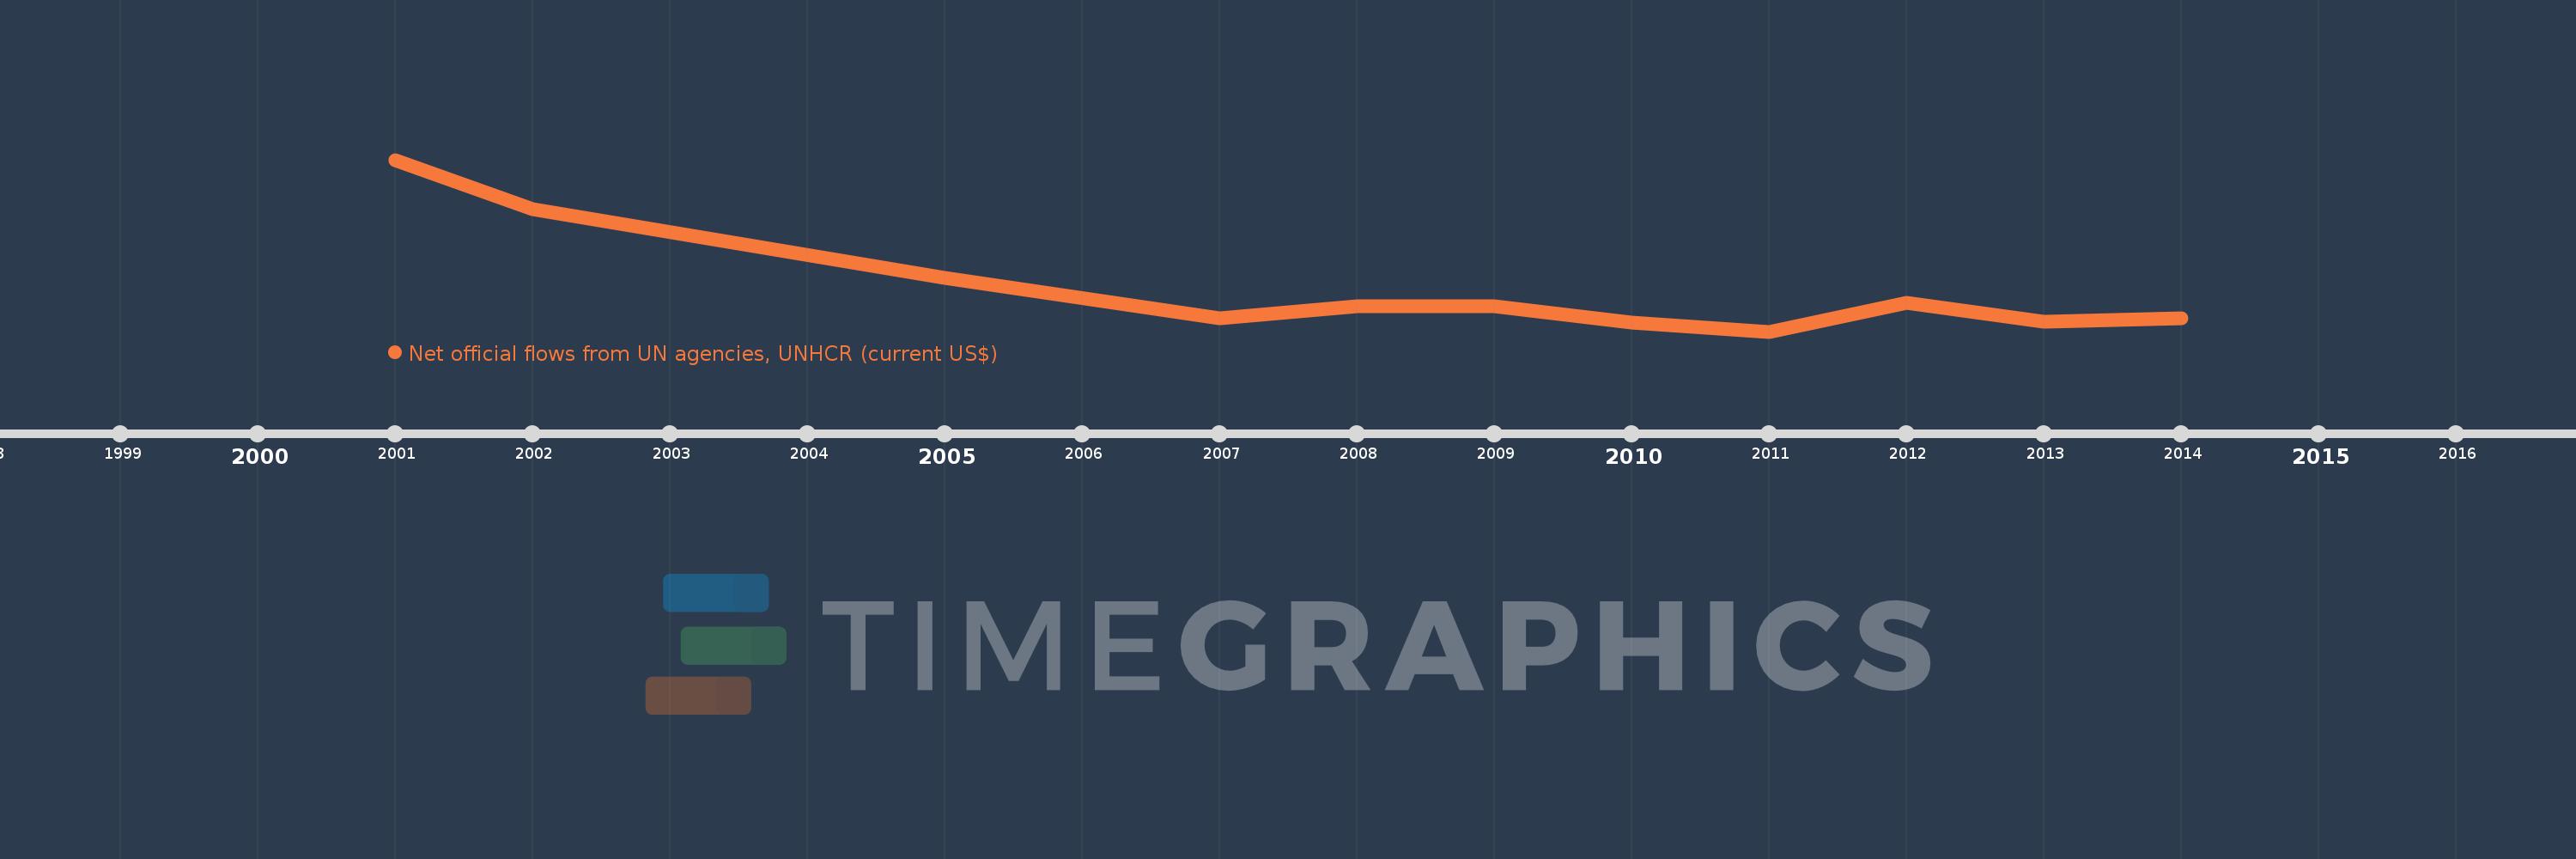
This timeline shows a graph from 2001 to 2014 of Serbia. No data until 2000. Number of actual observations by date: 11.

Source name:

World Development Indicators

Source organization:

Development Assistance Committee of the Organisation for Economic Co-operation and Development, Geographical Distribution of Financial Flows to Developing Countries, Development Co-operation Report, and International Development Statistics database. Data are available online at: www.oecd.org/dac/stats/idsonline.

Categories, topics:

Aid Effectiveness

Last updated:

apr 23, 2017

Indicators value changes by year

Meaning:
18.186 mln
Minimum:
1.67 mln
jan 1, 2011
Maximum:
67.59 mln
jan 1, 2001
At the date of observation
Value
Absolute change
Change from the previous value
jan 1, 2001
67.59 mln
+67.59 mln
0.0%
jan 1, 2002
48.74 mln
-18.85 mln
-27.89%
jan 1, 2005
22.36 mln
-26.38 mln
-54.12%
jan 1, 2007
6.72 mln
-15.64 mln
-69.95%
jan 1, 2008
11.54 mln
+4.82 mln
71.73%
jan 1, 2009
11.48 mln
-60.0K
-0.52%
jan 1, 2010
4.98 mln
-6.5 mln
-56.62%
jan 1, 2011
1.67 mln
-3.31 mln
-66.47%
jan 1, 2012
12.73 mln
+11.06 mln
662.28%
jan 1, 2013
5.37 mln
-7.36 mln
-57.82%
jan 1, 2014
6.87 mln
+1.5 mln
27.93%

Ranking of countries by current statistics by years