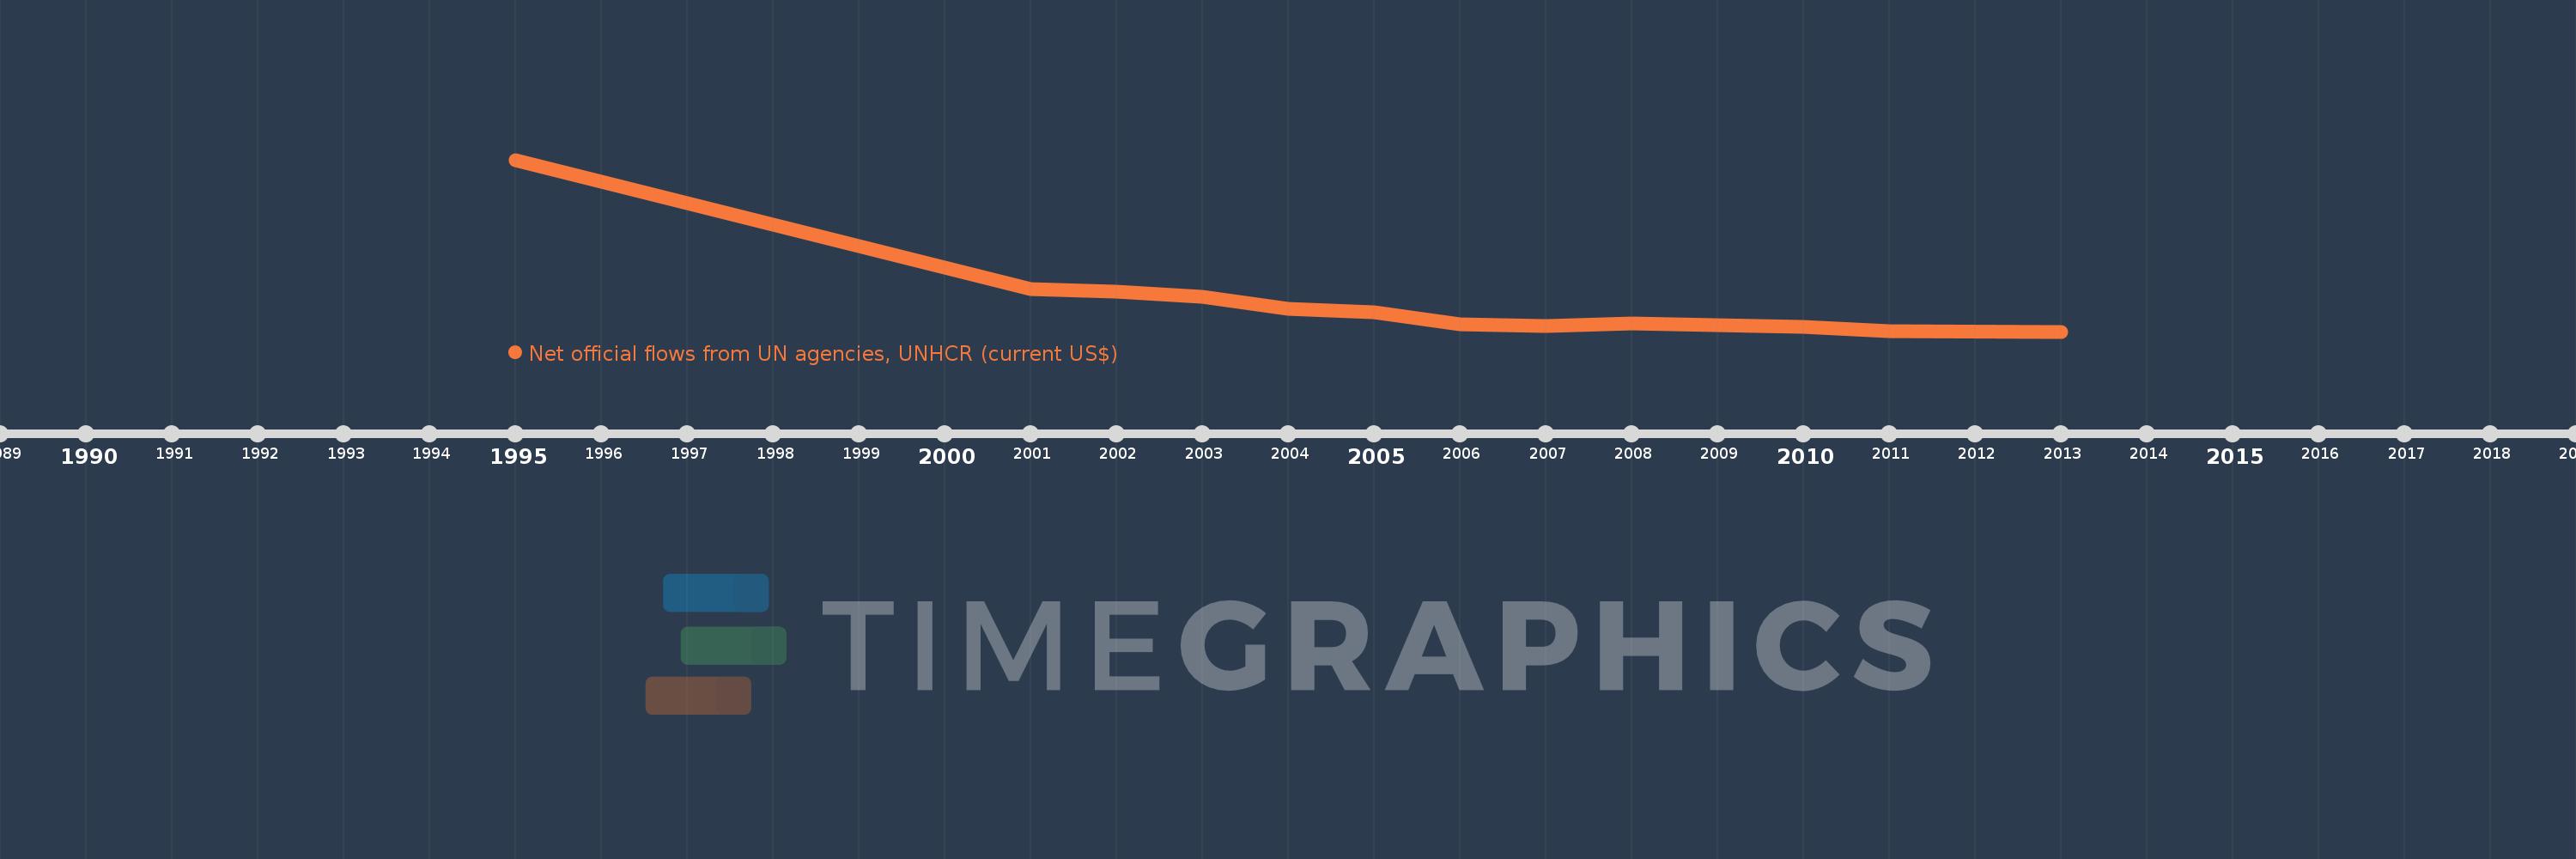
This timeline shows a graph from 1995 to 2013 of Bosnia and Herzegovina. No data until 1994. Number of actual observations by date: 13.
Source name:
World Development Indicators
Source organization:
Development Assistance Committee of the Organisation for Economic Co-operation and Development, Geographical Distribution of Financial Flows to Developing Countries, Development Co-operation Report, and International Development Statistics database. Data are available online at: www.oecd.org/dac/stats/idsonline.
Categories, topics:
Aid Effectiveness
Last updated:
apr 23, 2017
Indicators value changes by year
Meaning:
15.736 mln
Minimum:
30.0K
jan 1, 2013
Maximum:
96.55 mln
jan 1, 1995
At the date of observation
Value
Absolute change
Change from the previous value
jan 1, 1995
96.55 mln
+96.55 mln
0.0%
jan 1, 2001
24.08 mln
-72.47 mln
-75.06%
jan 1, 2002
22.28 mln
-1.8 mln
-7.48%
jan 1, 2003
19.7 mln
-2.58 mln
-11.58%
jan 1, 2004
13.02 mln
-6.68 mln
-33.91%
jan 1, 2005
10.95 mln
-2.07 mln
-15.9%
jan 1, 2006
3.96 mln
-6.99 mln
-63.84%
jan 1, 2007
3.15 mln
-810.0K
-20.45%
jan 1, 2008
4.44 mln
+1.29 mln
40.95%
jan 1, 2009
3.53 mln
-910.0K
-20.5%
jan 1, 2010
2.49 mln
-1.04 mln
-29.46%
jan 1, 2011
390.0K
-2.1 mln
-84.34%
jan 1, 2013
30.0K
-360.0K
-92.31%
Ranking of countries by current statistics by years