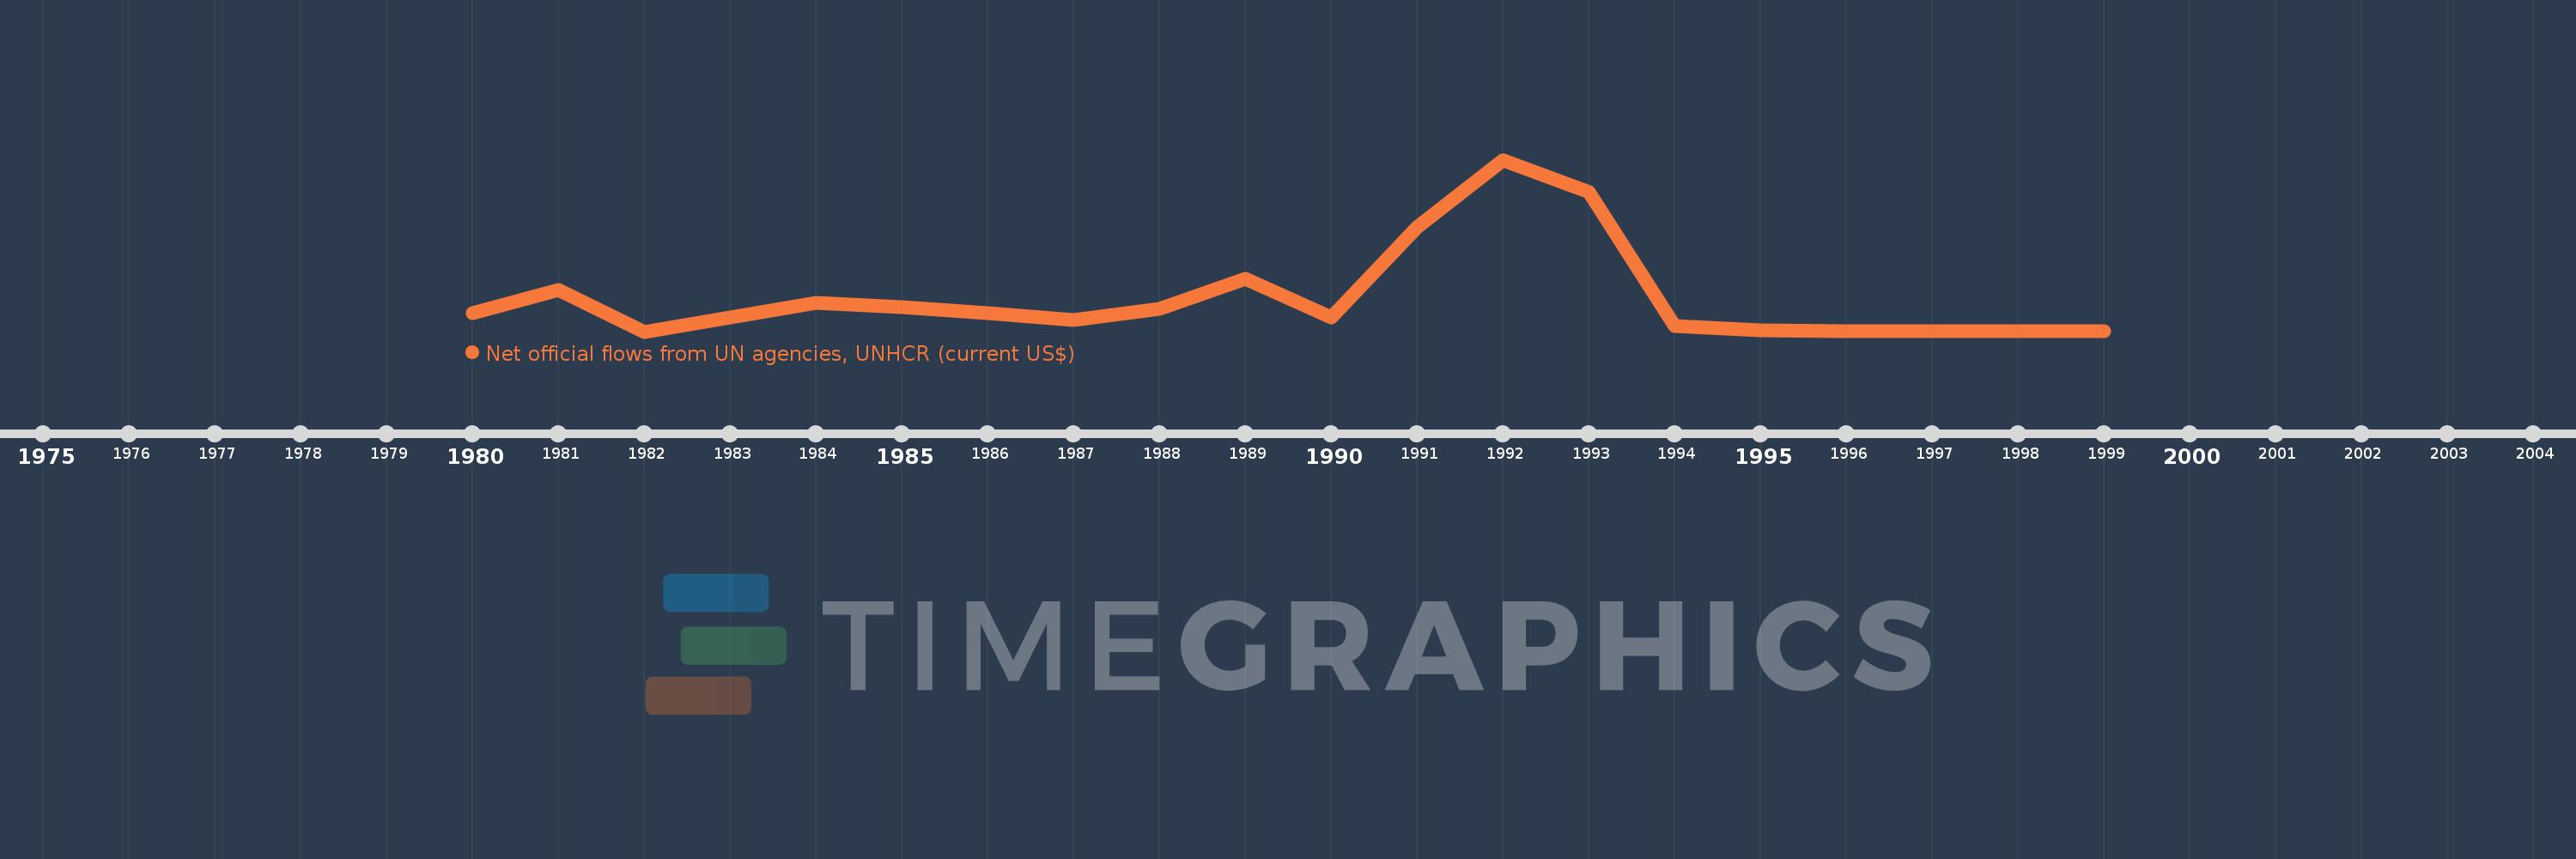
This timeline shows a graph from 1980 to 1999 of Nicaragua. No data until 1979. Number of actual observations by date: 19.
Source name:
World Development Indicators
Source organization:
Development Assistance Committee of the Organisation for Economic Co-operation and Development, Geographical Distribution of Financial Flows to Developing Countries, Development Co-operation Report, and International Development Statistics database. Data are available online at: www.oecd.org/dac/stats/idsonline.
Categories, topics:
Aid Effectiveness
Last updated:
apr 23, 2017
Indicators value changes by year
Meaning:
2.488 mln
Minimum:
30.0K
jan 1, 1982
Maximum:
12.2 mln
jan 1, 1992
At the date of observation
Value
Absolute change
Change from the previous value
jan 1, 1980
1.33 mln
+1.33 mln
0.0%
jan 1, 1981
3.01 mln
+1.68 mln
126.32%
jan 1, 1982
30.0K
-2.98 mln
-99.0%
jan 1, 1984
2.06 mln
+2.03 mln
6.77K%
jan 1, 1985
1.74 mln
-320.0K
-15.53%
jan 1, 1986
1.35 mln
-390.0K
-22.41%
jan 1, 1987
870.0K
-480.0K
-35.56%
jan 1, 1988
1.67 mln
+800.0K
91.95%
jan 1, 1989
3.76 mln
+2.09 mln
125.15%
jan 1, 1990
1.06 mln
-2.7 mln
-71.81%
jan 1, 1991
7.43 mln
+6.37 mln
600.94%
jan 1, 1992
12.2 mln
+4.77 mln
64.2%
jan 1, 1993
9.94 mln
-2.26 mln
-18.52%
jan 1, 1994
400.0K
-9.54 mln
-95.98%
jan 1, 1995
100.0K
-300.0K
-75.0%
jan 1, 1996
80.0K
-20.0K
-20.0%
jan 1, 1997
90.0K
+10.0K
12.5%
jan 1, 1998
90.0K
0.0
0.0%
jan 1, 1999
60.0K
-30.0K
-33.33%
Ranking of countries by current statistics by years