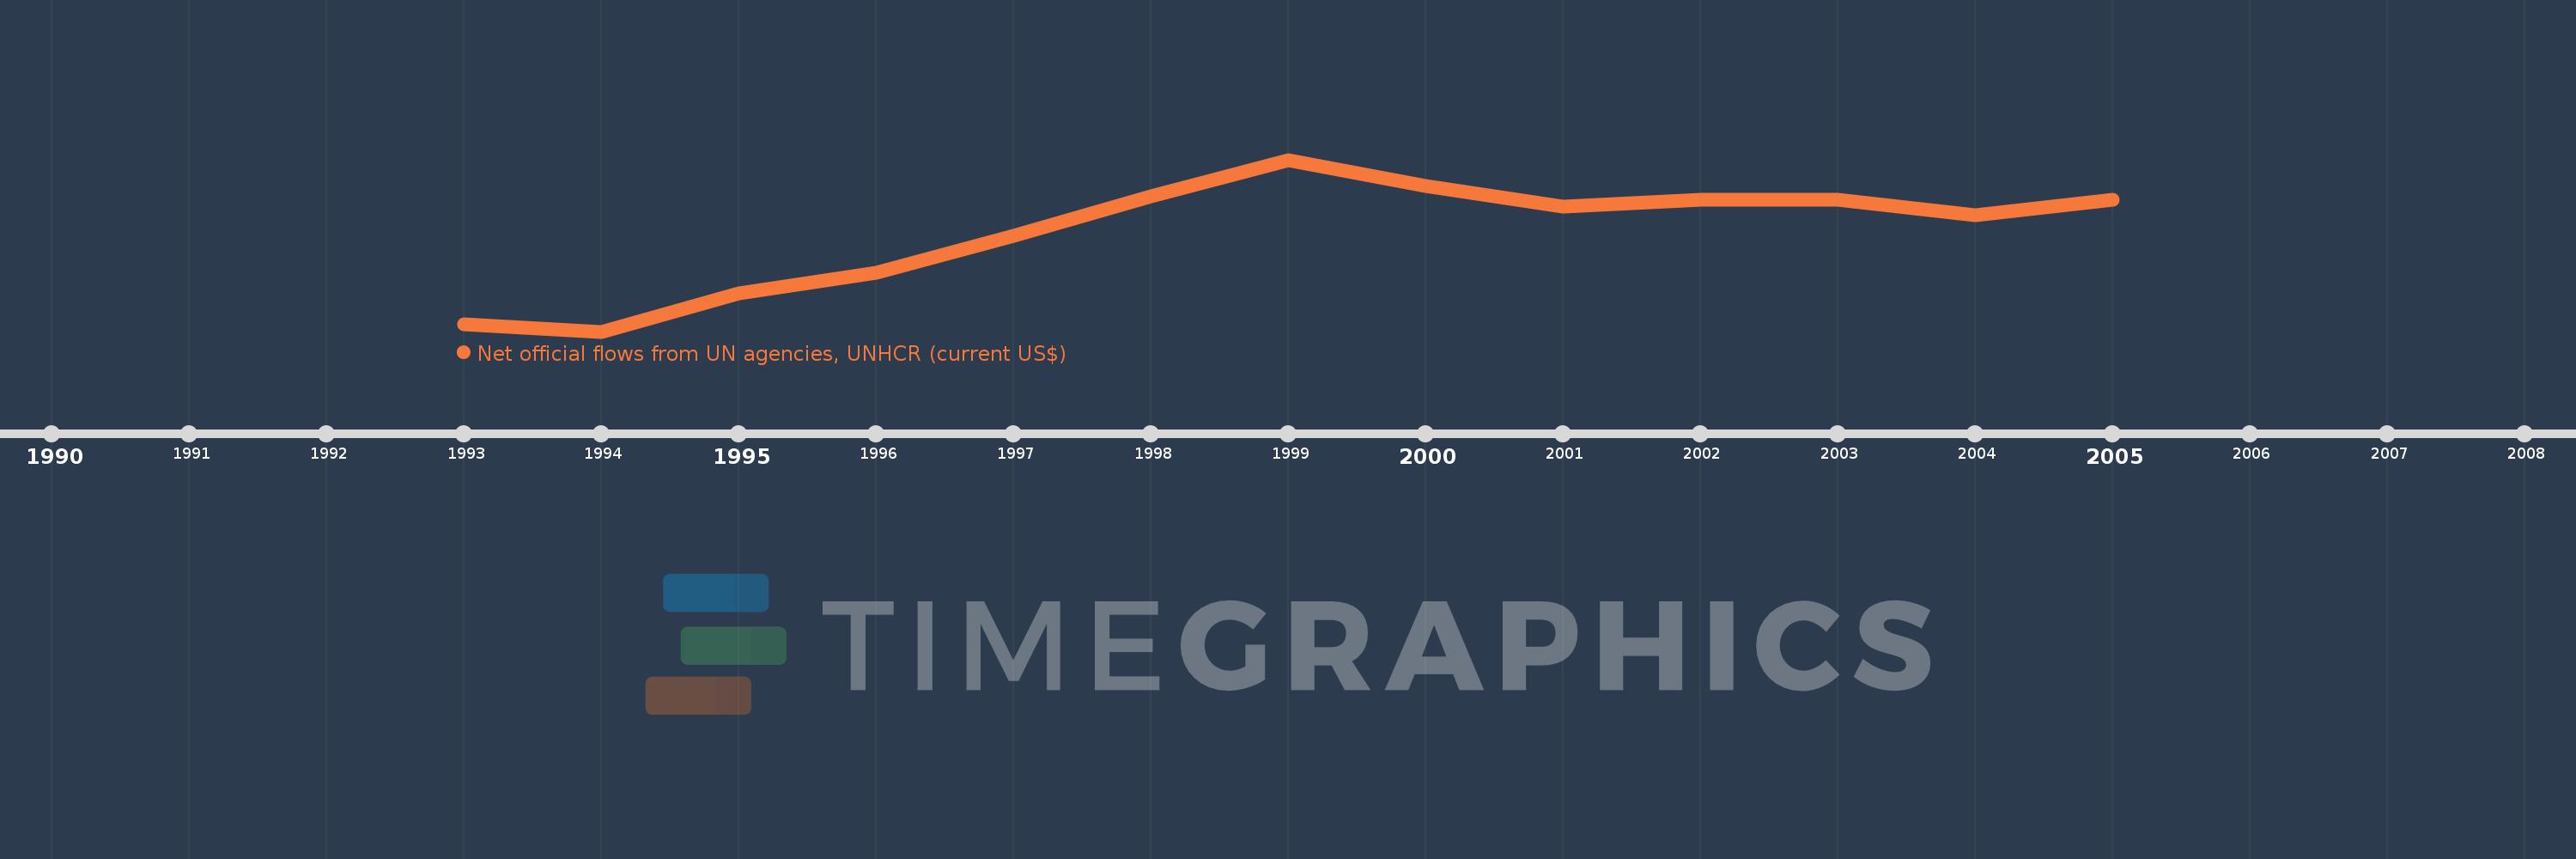
This timeline shows a graph from 1993 to 2005 of Romania. No data until 1992. Number of actual observations by date: 13.
Source name:
World Development Indicators
Source organization:
Development Assistance Committee of the Organisation for Economic Co-operation and Development, Geographical Distribution of Financial Flows to Developing Countries, Development Co-operation Report, and International Development Statistics database. Data are available online at: www.oecd.org/dac/stats/idsonline.
Categories, topics:
Aid Effectiveness
Last updated:
apr 23, 2017
Indicators value changes by year
Meaning:
781.538K
Minimum:
210.0K
jan 1, 1994
Maximum:
1.2 mln
jan 1, 1999
At the date of observation
Value
Absolute change
Change from the previous value
jan 1, 1993
250.0K
+250.0K
0.0%
jan 1, 1994
210.0K
-40.0K
-16.0%
jan 1, 1995
430.0K
+220.0K
104.76%
jan 1, 1996
550.0K
+120.0K
27.91%
jan 1, 1997
760.0K
+210.0K
38.18%
jan 1, 1998
990.0K
+230.0K
30.26%
jan 1, 1999
1.2 mln
+210.0K
21.21%
jan 1, 2000
1.05 mln
-150.0K
-12.5%
jan 1, 2001
930.0K
-120.0K
-11.43%
jan 1, 2002
970.0K
+40.0K
4.3%
jan 1, 2003
970.0K
0.0
0.0%
jan 1, 2004
880.0K
-90.0K
-9.28%
jan 1, 2005
970.0K
+90.0K
10.23%
Ranking of countries by current statistics by years