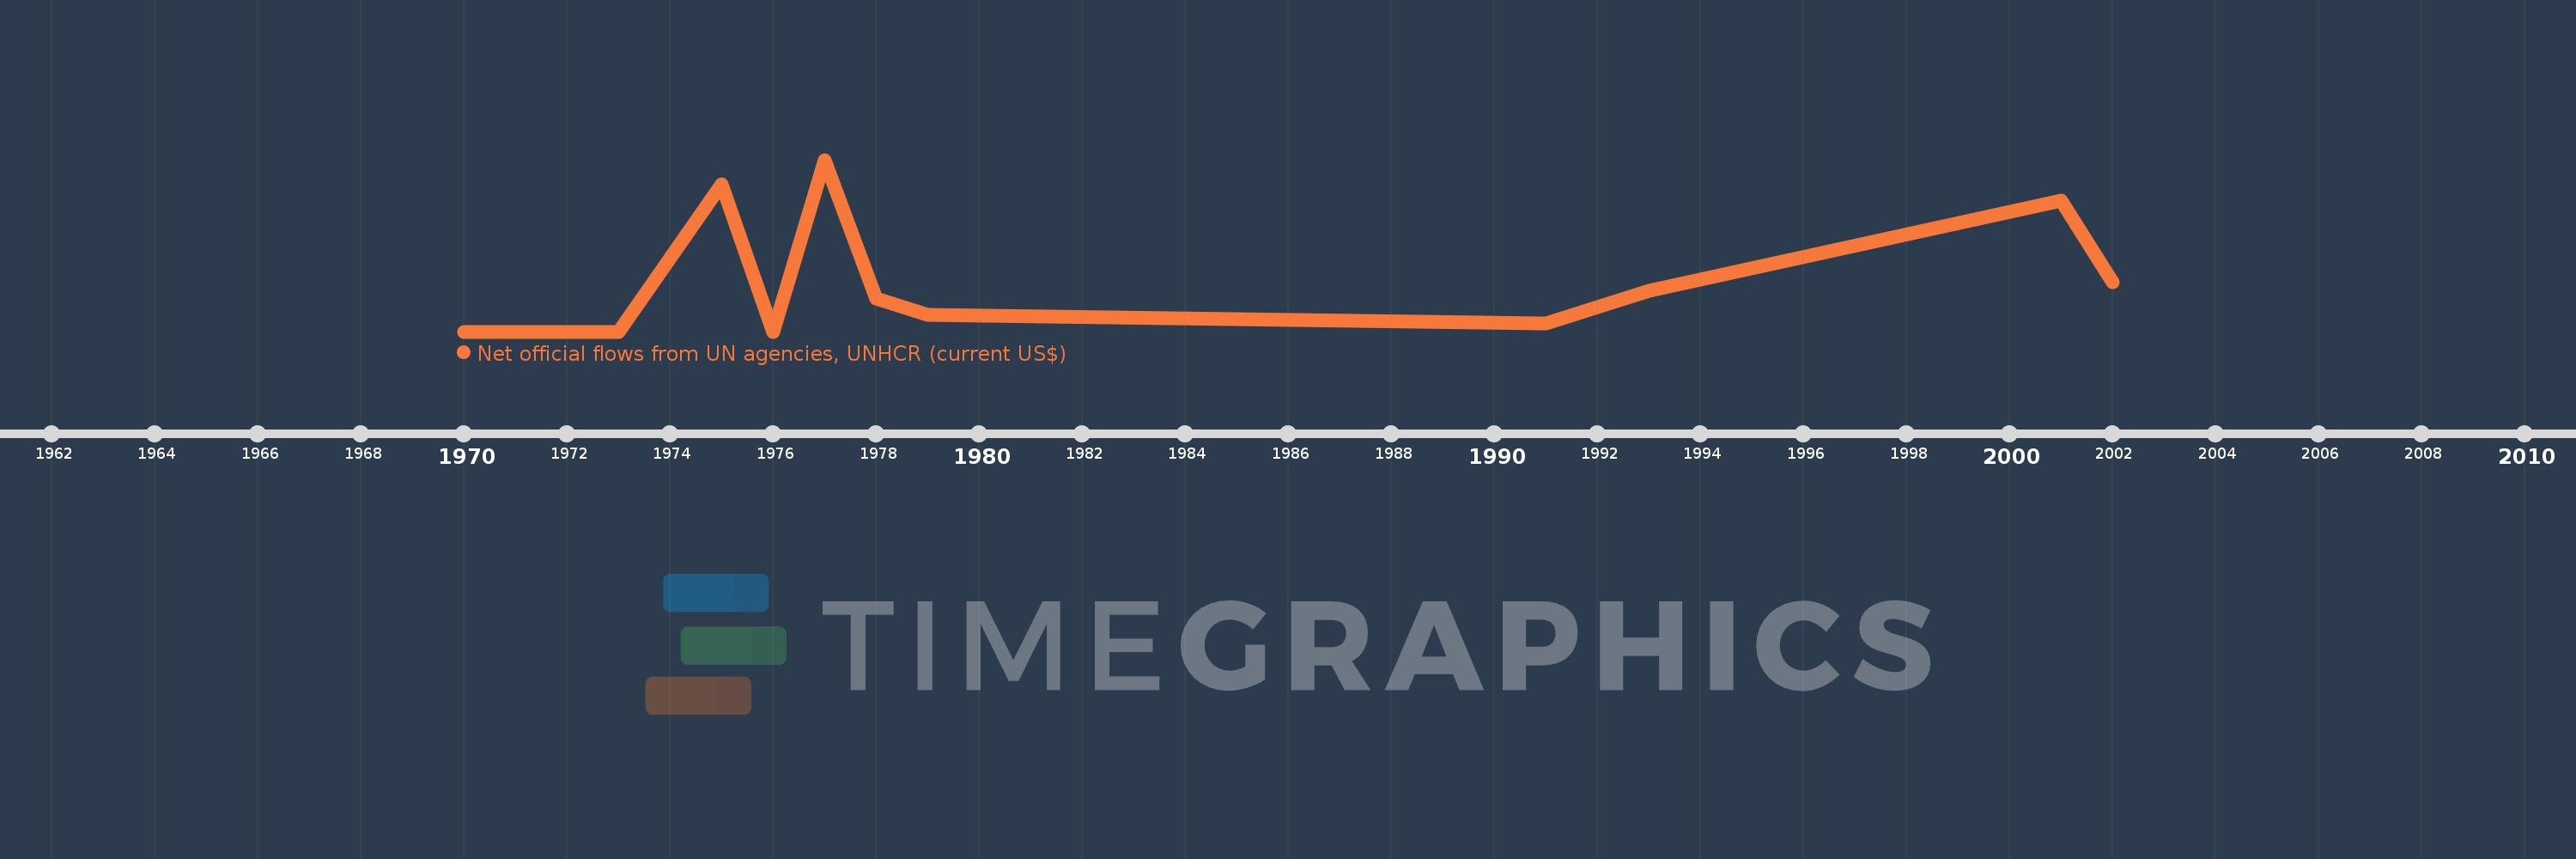
This timeline shows a graph from 1970 to 2002 of United Arab Emirates. No data until 1969. Number of actual observations by date: 15.
Source name:
World Development Indicators
Source organization:
Development Assistance Committee of the Organisation for Economic Co-operation and Development, Geographical Distribution of Financial Flows to Developing Countries, Development Co-operation Report, and International Development Statistics database. Data are available online at: www.oecd.org/dac/stats/idsonline.
Categories, topics:
Aid Effectiveness
Last updated:
apr 23, 2017
Indicators value changes by year
Meaning:
66.667K
Minimum:
10.0K
jan 1, 1970
Maximum:
220.0K
jan 1, 1977
At the date of observation
Value
Absolute change
Change from the previous value
jan 1, 1970
10.0K
+10.0K
0.0%
jan 1, 1971
10.0K
0.0
0.0%
jan 1, 1972
10.0K
0.0
0.0%
jan 1, 1973
10.0K
0.0
0.0%
jan 1, 1974
100.0K
+90.0K
900.0%
jan 1, 1975
190.0K
+90.0K
90.0%
jan 1, 1976
10.0K
-180.0K
-94.74%
jan 1, 1977
220.0K
+210.0K
2.1K%
jan 1, 1978
50.0K
-170.0K
-77.27%
jan 1, 1979
30.0K
-20.0K
-40.0%
jan 1, 1991
20.0K
-10.0K
-33.33%
jan 1, 1992
40.0K
+20.0K
100.0%
jan 1, 1993
60.0K
+20.0K
50.0%
jan 1, 2001
170.0K
+110.0K
183.33%
jan 1, 2002
70.0K
-100.0K
-58.82%
Ranking of countries by current statistics by years