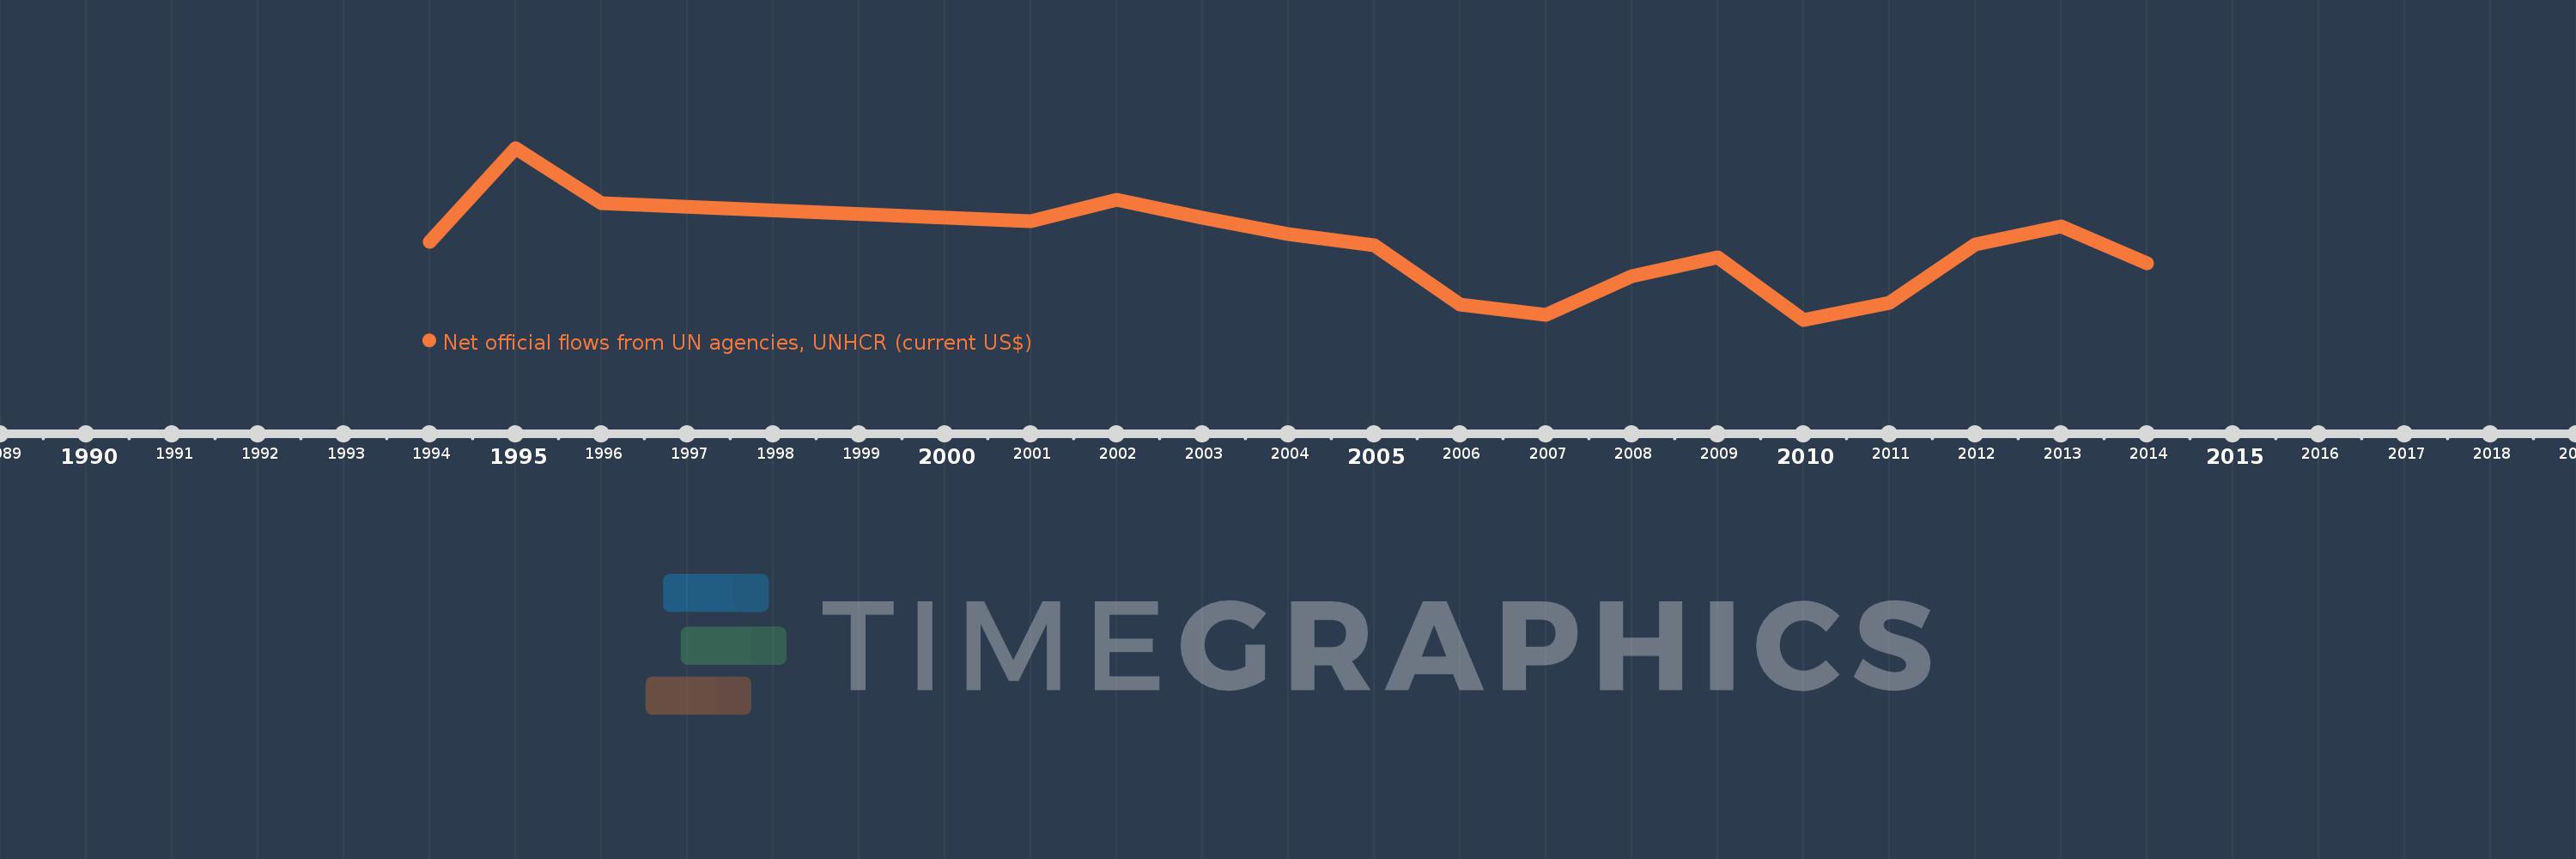
This timeline shows a graph from 1994 to 2014 of Georgia. No data until 1993. Number of actual observations by date: 17.
Source name:
World Development Indicators
Source organization:
Development Assistance Committee of the Organisation for Economic Co-operation and Development, Geographical Distribution of Financial Flows to Developing Countries, Development Co-operation Report, and International Development Statistics database. Data are available online at: www.oecd.org/dac/stats/idsonline.
Categories, topics:
Aid Effectiveness
Last updated:
apr 23, 2017
Indicators value changes by year
Meaning:
3.325 mln
Minimum:
960.0K
jan 1, 2010
Maximum:
6.65 mln
jan 1, 1995
At the date of observation
Value
Absolute change
Change from the previous value
jan 1, 1994
3.53 mln
+3.53 mln
0.0%
jan 1, 1995
6.65 mln
+3.12 mln
88.39%
jan 1, 1996
4.83 mln
-1.82 mln
-27.37%
jan 1, 2001
4.21 mln
-620.0K
-12.84%
jan 1, 2002
4.94 mln
+730.0K
17.34%
jan 1, 2003
4.34 mln
-600.0K
-12.15%
jan 1, 2004
3.8 mln
-540.0K
-12.44%
jan 1, 2005
3.43 mln
-370.0K
-9.74%
jan 1, 2006
1.45 mln
-1.98 mln
-57.73%
jan 1, 2007
1.11 mln
-340.0K
-23.45%
jan 1, 2008
2.4 mln
+1.29 mln
116.22%
jan 1, 2009
3.02 mln
+620.0K
25.83%
jan 1, 2010
960.0K
-2.06 mln
-68.21%
jan 1, 2011
1.52 mln
+560.0K
58.33%
jan 1, 2012
3.46 mln
+1.94 mln
127.63%
jan 1, 2013
4.04 mln
+580.0K
16.76%
jan 1, 2014
2.83 mln
-1.21 mln
-29.95%
Ranking of countries by current statistics by years