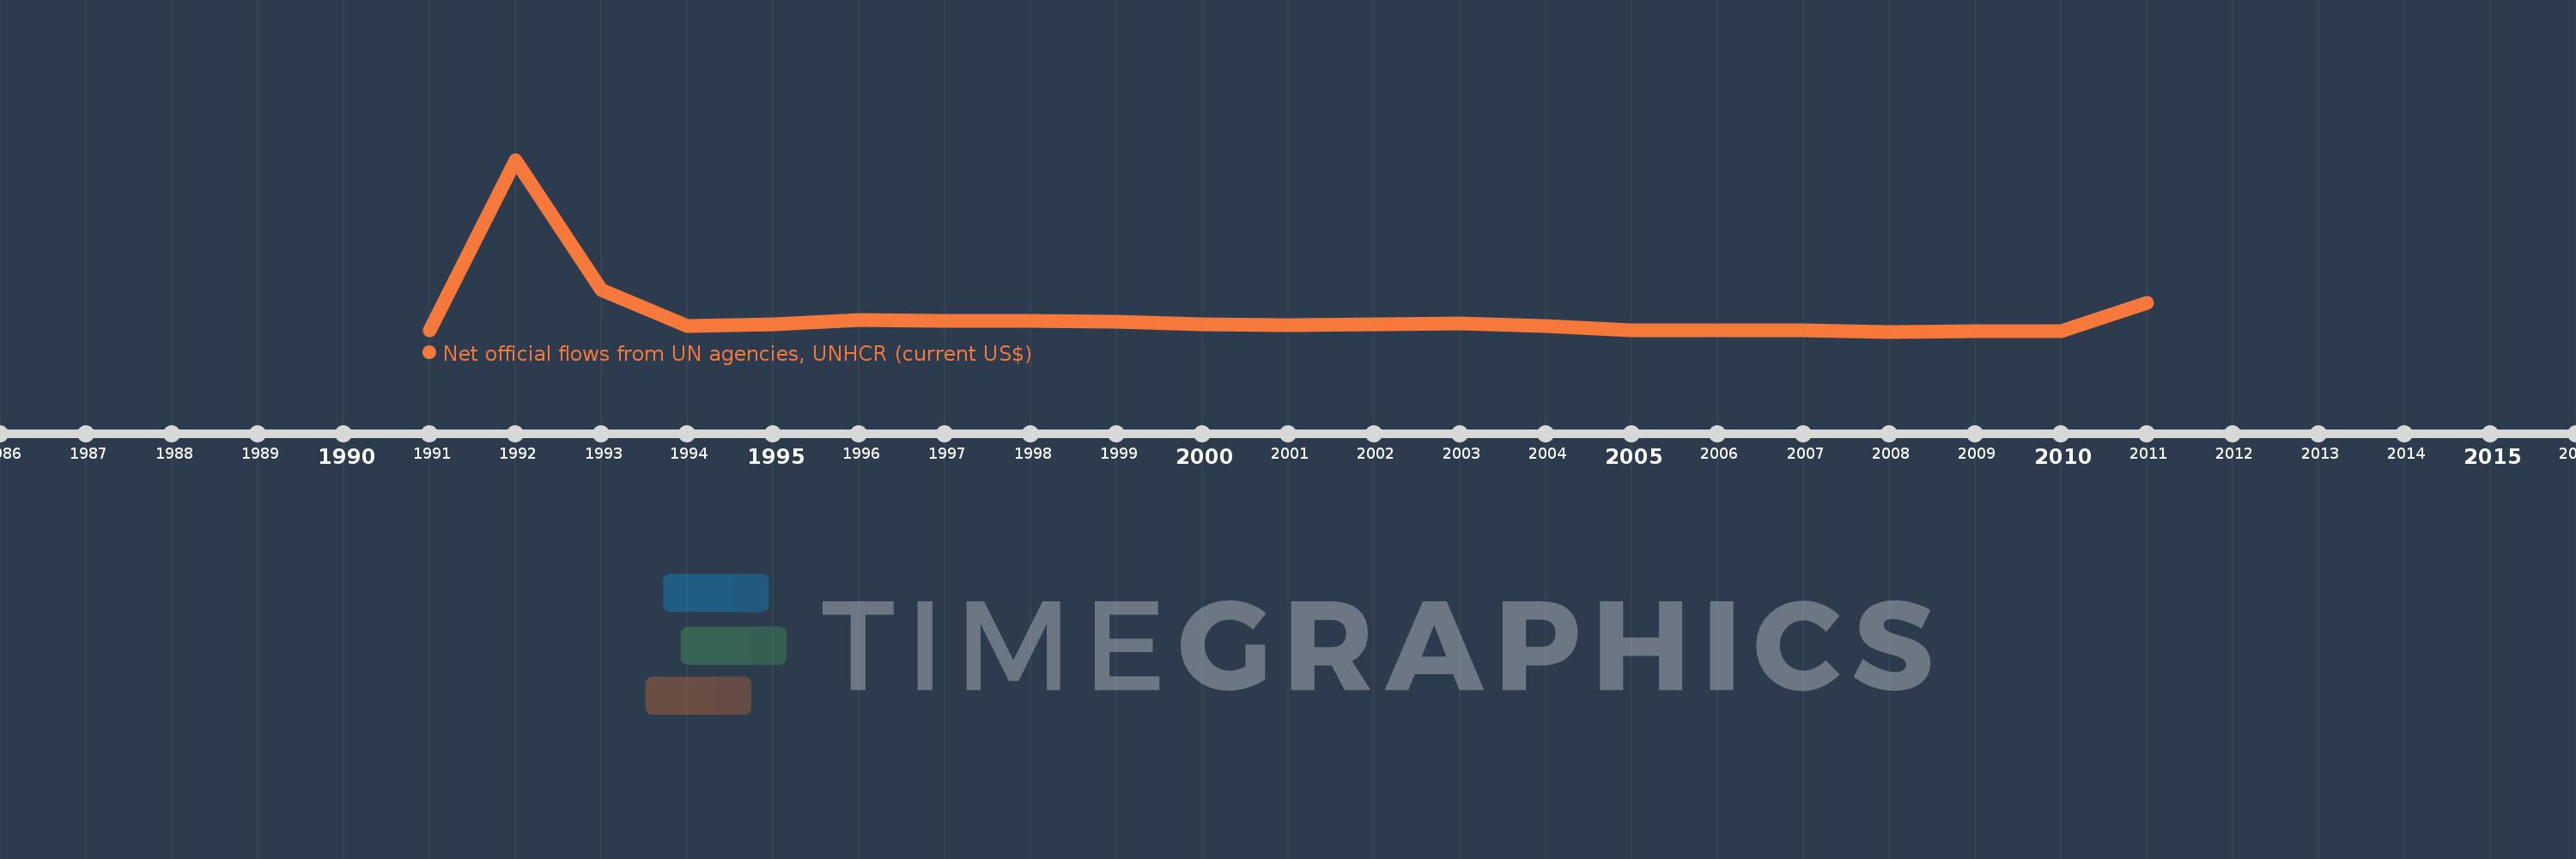
This timeline shows a graph from 1991 to 2011 of Iraq. No data until 1990. Number of actual observations by date: 20.
Source name:
World Development Indicators
Source organization:
Development Assistance Committee of the Organisation for Economic Co-operation and Development, Geographical Distribution of Financial Flows to Developing Countries, Development Co-operation Report, and International Development Statistics database. Data are available online at: www.oecd.org/dac/stats/idsonline.
Categories, topics:
Aid Effectiveness
Last updated:
apr 23, 2017
Indicators value changes by year
Meaning:
6.434 mln
Minimum:
90.0K
jan 1, 2008
Maximum:
64.79 mln
jan 1, 1992
At the date of observation
Value
Absolute change
Change from the previous value
jan 1, 1991
520.0K
+520.0K
0.0%
jan 1, 1992
64.79 mln
+64.27 mln
12.36K%
jan 1, 1993
15.84 mln
-48.95 mln
-75.55%
jan 1, 1994
2.19 mln
-13.65 mln
-86.17%
jan 1, 1995
2.94 mln
+750.0K
34.25%
jan 1, 1996
4.51 mln
+1.57 mln
53.4%
jan 1, 1997
4.02 mln
-490.0K
-10.86%
jan 1, 1998
4.21 mln
+190.0K
4.73%
jan 1, 1999
3.7 mln
-510.0K
-12.11%
jan 1, 2000
2.92 mln
-780.0K
-21.08%
jan 1, 2001
2.56 mln
-360.0K
-12.33%
jan 1, 2002
2.74 mln
+180.0K
7.03%
jan 1, 2003
3.17 mln
+430.0K
15.69%
jan 1, 2004
2.12 mln
-1.05 mln
-33.12%
jan 1, 2005
430.0K
-1.69 mln
-79.72%
jan 1, 2007
590.0K
+160.0K
37.21%
jan 1, 2008
90.0K
-500.0K
-84.75%
jan 1, 2009
160.0K
+70.0K
77.78%
jan 1, 2010
340.0K
+180.0K
112.5%
jan 1, 2011
10.84 mln
+10.5 mln
3.09K%
Ranking of countries by current statistics by years