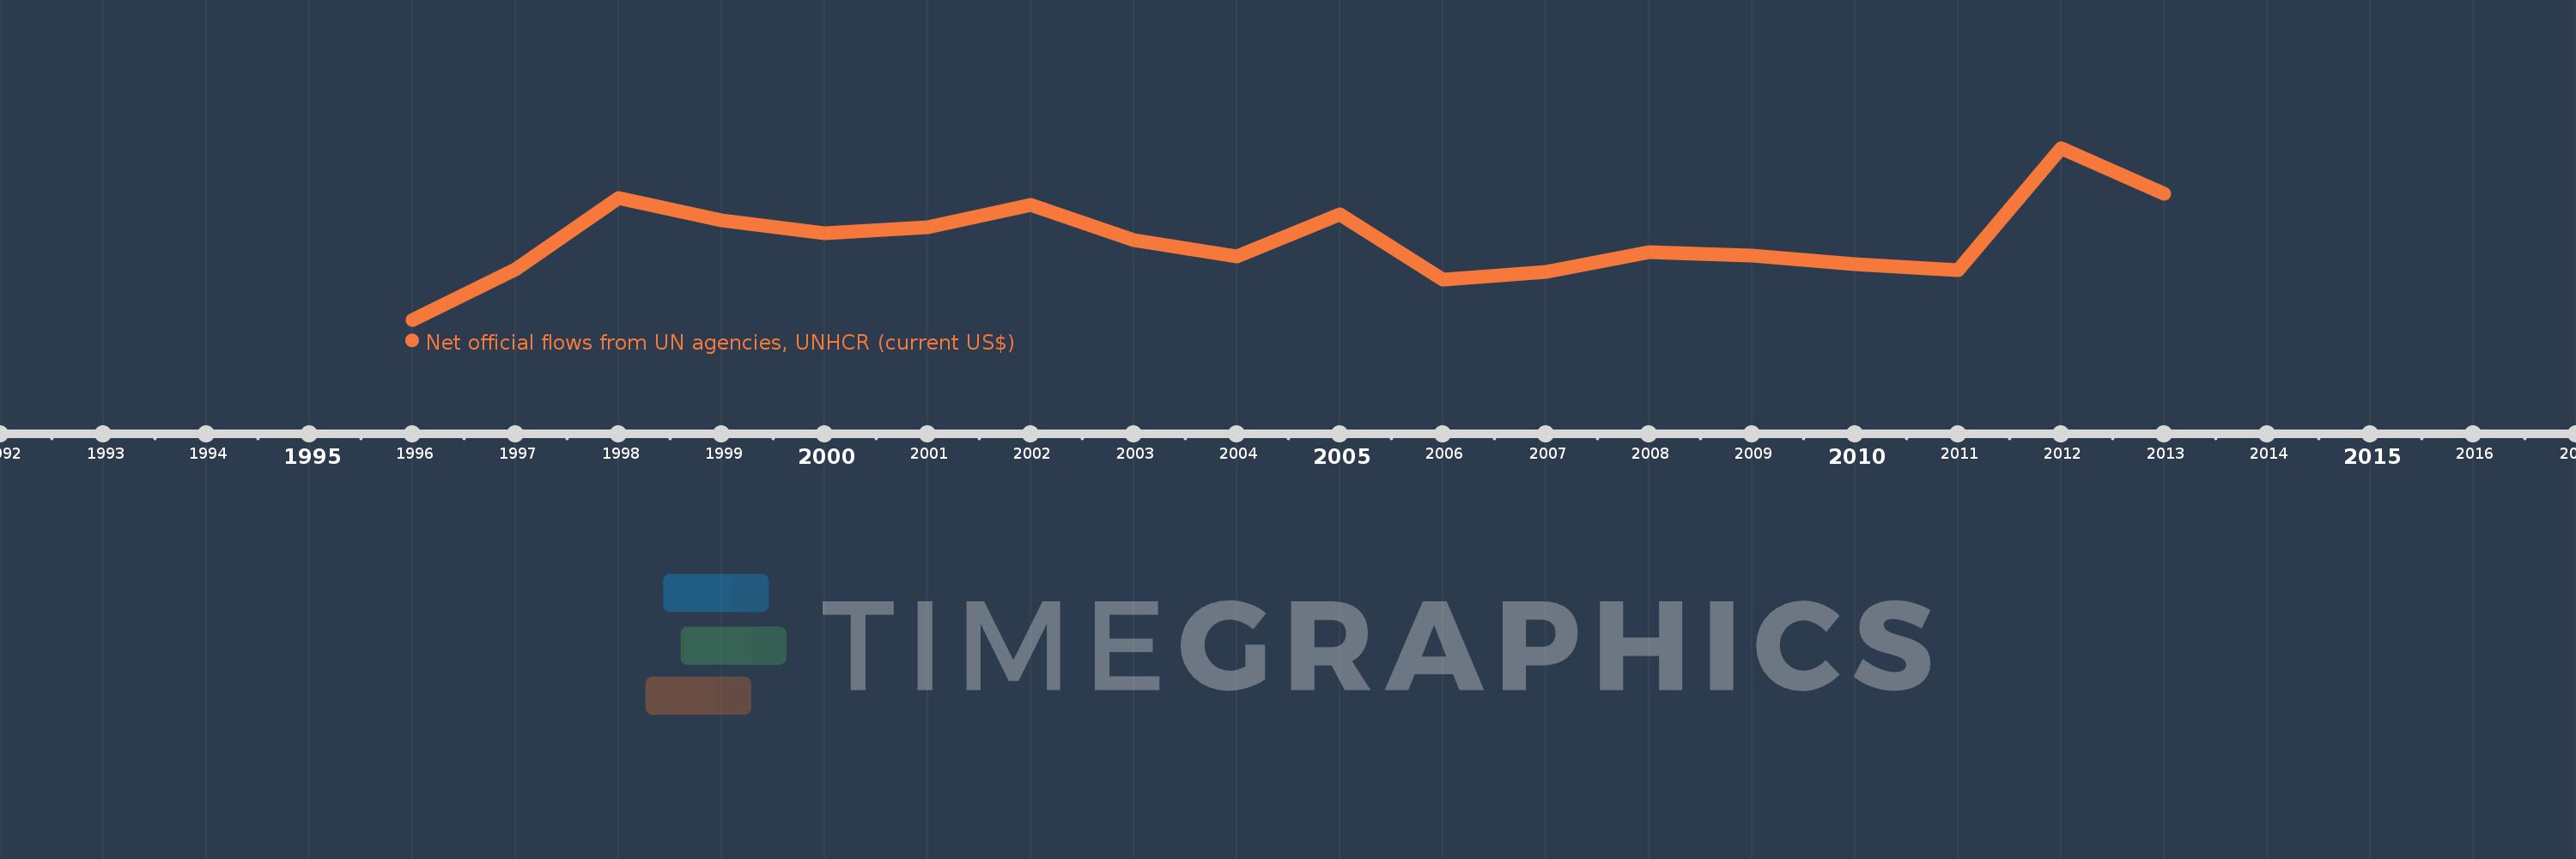
This timeline shows a graph from 1996 to 2013 of Ukraine. No data until 1995. Number of actual observations by date: 18.
Source name:
World Development Indicators
Source organization:
Development Assistance Committee of the Organisation for Economic Co-operation and Development, Geographical Distribution of Financial Flows to Developing Countries, Development Co-operation Report, and International Development Statistics database. Data are available online at: www.oecd.org/dac/stats/idsonline.
Categories, topics:
Aid Effectiveness
Last updated:
apr 23, 2017
Indicators value changes by year
Meaning:
2.047 mln
Minimum:
380.0K
jan 1, 1996
Maximum:
3.97 mln
jan 1, 2012
At the date of observation
Value
Absolute change
Change from the previous value
jan 1, 1996
380.0K
+380.0K
0.0%
jan 1, 1997
1.43 mln
+1.05 mln
276.32%
jan 1, 1998
2.93 mln
+1.5 mln
104.9%
jan 1, 1999
2.45 mln
-480.0K
-16.38%
jan 1, 2000
2.19 mln
-260.0K
-10.61%
jan 1, 2001
2.31 mln
+120.0K
5.48%
jan 1, 2002
2.78 mln
+470.0K
20.35%
jan 1, 2003
2.05 mln
-730.0K
-26.26%
jan 1, 2004
1.7 mln
-350.0K
-17.07%
jan 1, 2005
2.59 mln
+890.0K
52.35%
jan 1, 2006
1.21 mln
-1.38 mln
-53.28%
jan 1, 2007
1.38 mln
+170.0K
14.05%
jan 1, 2008
1.79 mln
+410.0K
29.71%
jan 1, 2009
1.72 mln
-70.0K
-3.91%
jan 1, 2010
1.54 mln
-180.0K
-10.47%
jan 1, 2011
1.42 mln
-120.0K
-7.79%
jan 1, 2012
3.97 mln
+2.55 mln
179.58%
jan 1, 2013
3.01 mln
-960.0K
-24.18%
Ranking of countries by current statistics by years