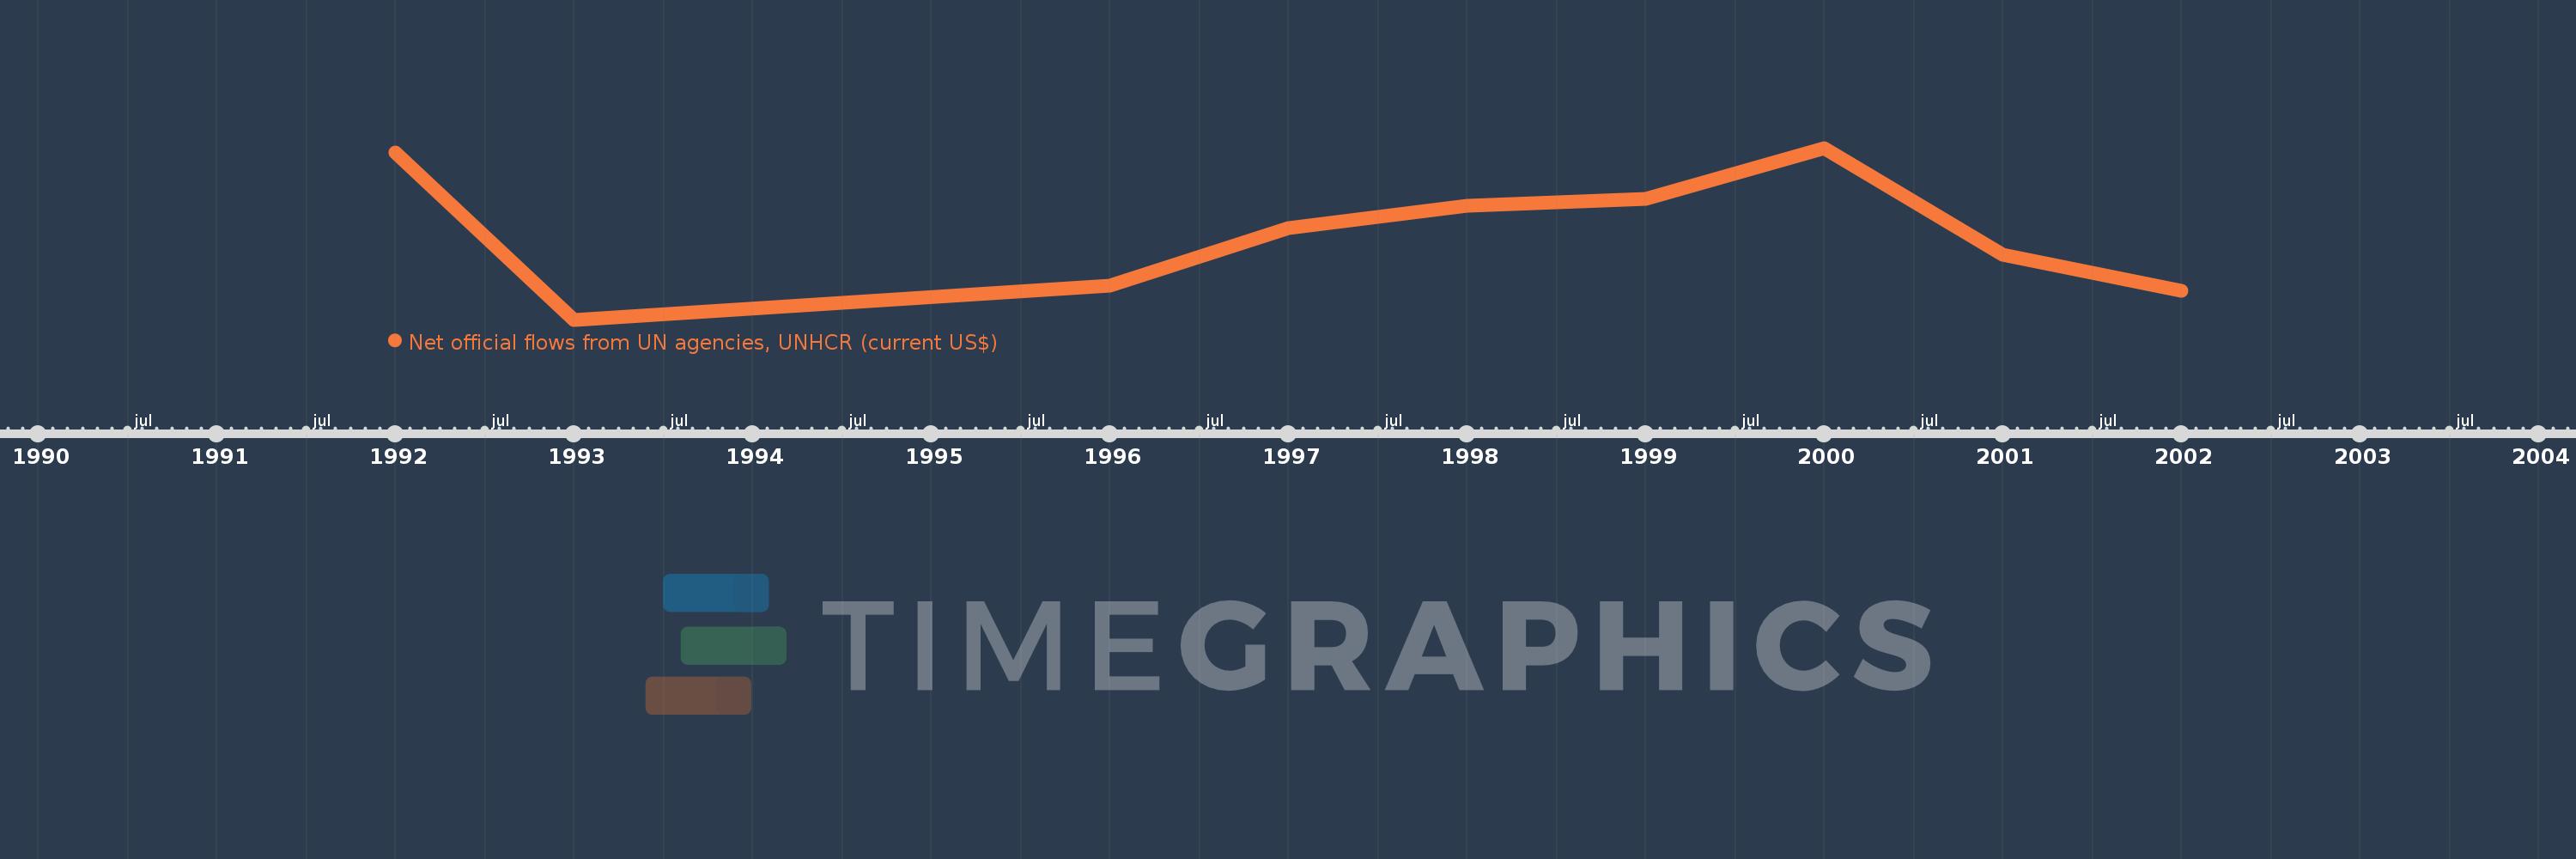
This timeline shows a graph from 1992 to 2002 of Kuwait. No data until 1991. Number of actual observations by date: 9.
Source name:
World Development Indicators
Source organization:
Development Assistance Committee of the Organisation for Economic Co-operation and Development, Geographical Distribution of Financial Flows to Developing Countries, Development Co-operation Report, and International Development Statistics database. Data are available online at: www.oecd.org/dac/stats/idsonline.
Categories, topics:
Aid Effectiveness
Last updated:
apr 23, 2017
Indicators value changes by year
Meaning:
674.444K
Minimum:
310.0K
jan 1, 1993
Maximum:
1.02 mln
jan 1, 2000
At the date of observation
Value
Absolute change
Change from the previous value
jan 1, 1992
1000.0K
+1000.0K
0.0%
jan 1, 1993
310.0K
-690.0K
-69.0%
jan 1, 1996
450.0K
+140.0K
45.16%
jan 1, 1997
690.0K
+240.0K
53.33%
jan 1, 1998
780.0K
+90.0K
13.04%
jan 1, 1999
810.0K
+30.0K
3.85%
jan 1, 2000
1.02 mln
+210.0K
25.93%
jan 1, 2001
580.0K
-440.0K
-43.14%
jan 1, 2002
430.0K
-150.0K
-25.86%
Ranking of countries by current statistics by years