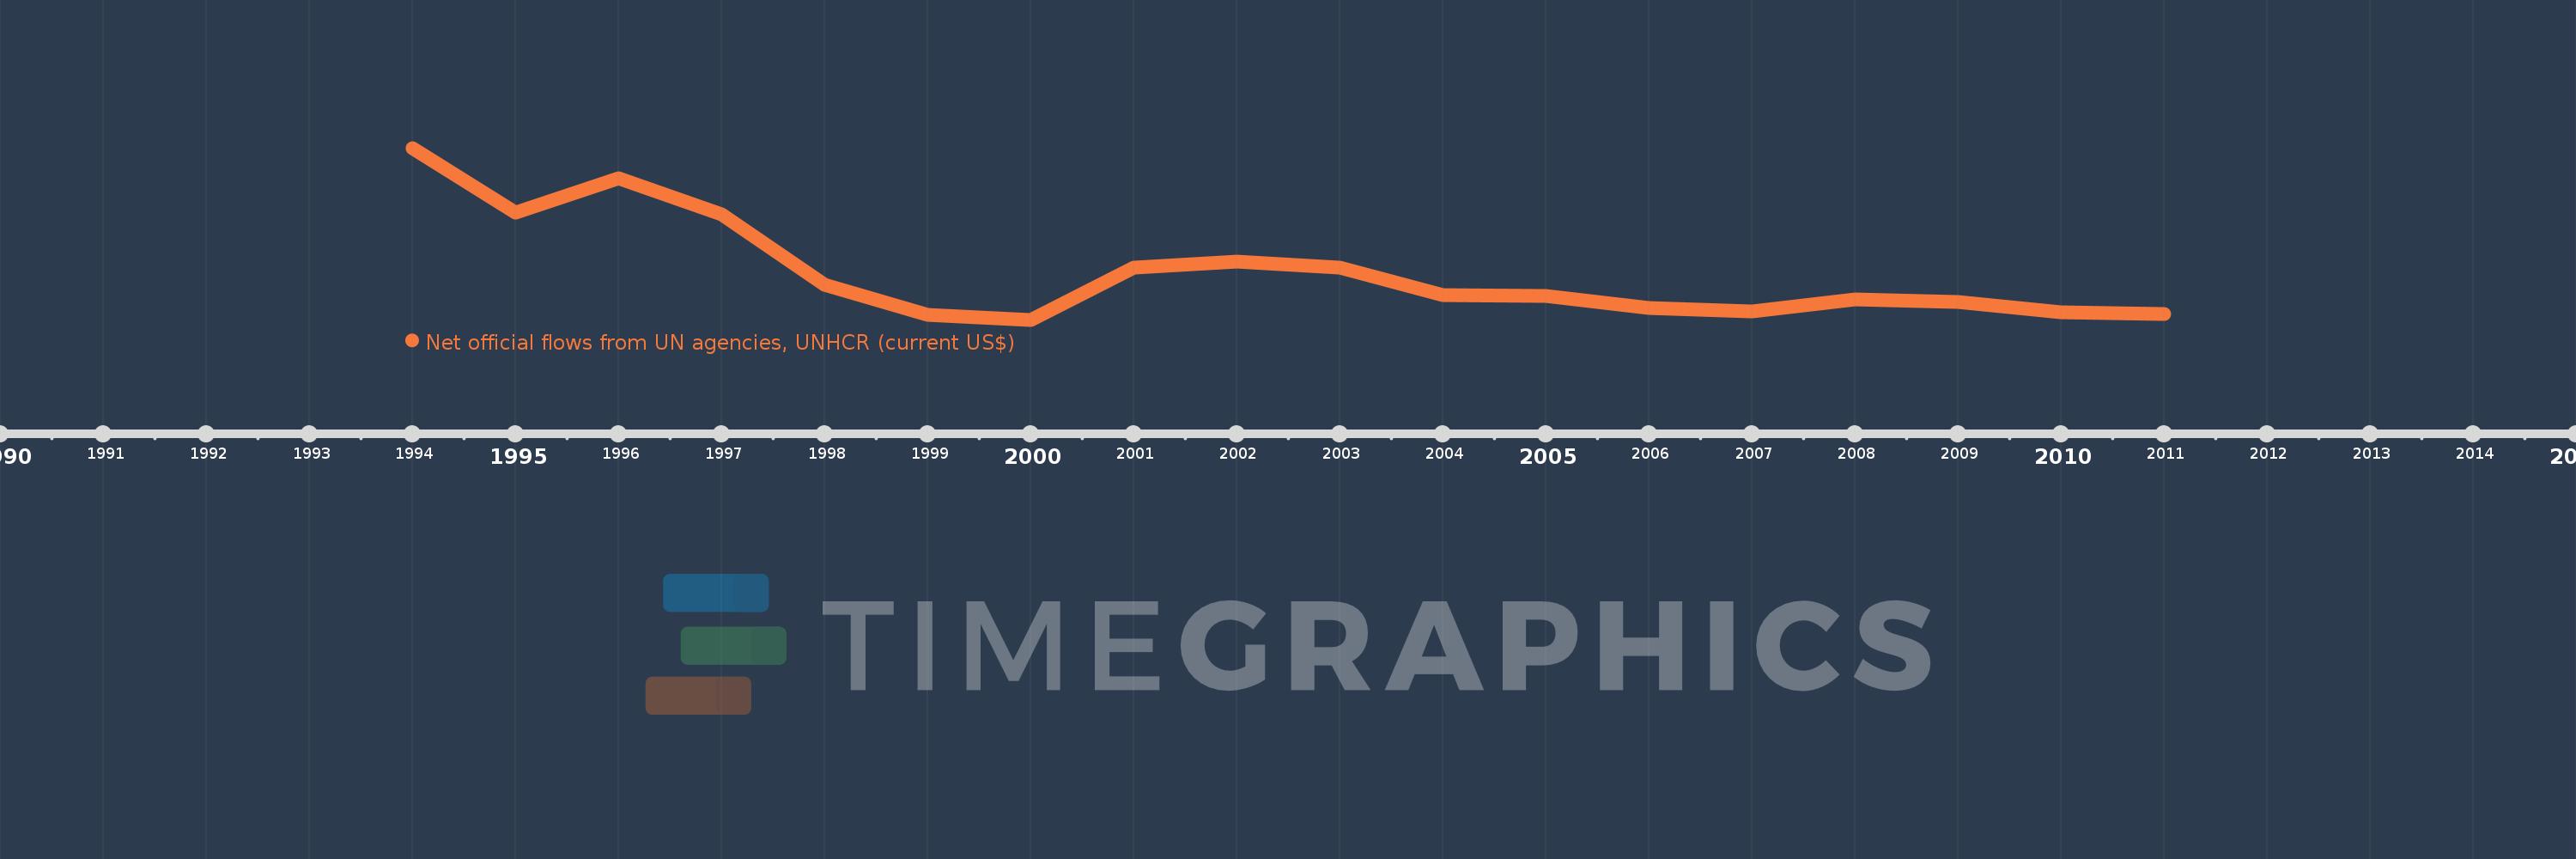
This timeline shows a graph from 1994 to 2011 of Armenia. No data until 1993. Number of actual observations by date: 18.
Source name:
World Development Indicators
Source organization:
Development Assistance Committee of the Organisation for Economic Co-operation and Development, Geographical Distribution of Financial Flows to Developing Countries, Development Co-operation Report, and International Development Statistics database. Data are available online at: www.oecd.org/dac/stats/idsonline.
Categories, topics:
Aid Effectiveness
Last updated:
apr 23, 2017
Indicators value changes by year
Meaning:
2.112 mln
Minimum:
320.0K
jan 1, 2000
Maximum:
6.86 mln
jan 1, 1994
At the date of observation
Value
Absolute change
Change from the previous value
jan 1, 1994
6.86 mln
+6.86 mln
0.0%
jan 1, 1995
4.41 mln
-2.45 mln
-35.71%
jan 1, 1996
5.7 mln
+1.29 mln
29.25%
jan 1, 1997
4.34 mln
-1.36 mln
-23.86%
jan 1, 1998
1.64 mln
-2.7 mln
-62.21%
jan 1, 1999
520.0K
-1.12 mln
-68.29%
jan 1, 2000
320.0K
-200.0K
-38.46%
jan 1, 2001
2.32 mln
+2.0 mln
625.0%
jan 1, 2002
2.52 mln
+200.0K
8.62%
jan 1, 2003
2.29 mln
-230.0K
-9.13%
jan 1, 2004
1.25 mln
-1.04 mln
-45.41%
jan 1, 2005
1.21 mln
-40.0K
-3.2%
jan 1, 2006
760.0K
-450.0K
-37.19%
jan 1, 2007
630.0K
-130.0K
-17.11%
jan 1, 2008
1.1 mln
+470.0K
74.6%
jan 1, 2009
990.0K
-110.0K
-10.0%
jan 1, 2010
610.0K
-380.0K
-38.38%
jan 1, 2011
550.0K
-60.0K
-9.84%
Ranking of countries by current statistics by years