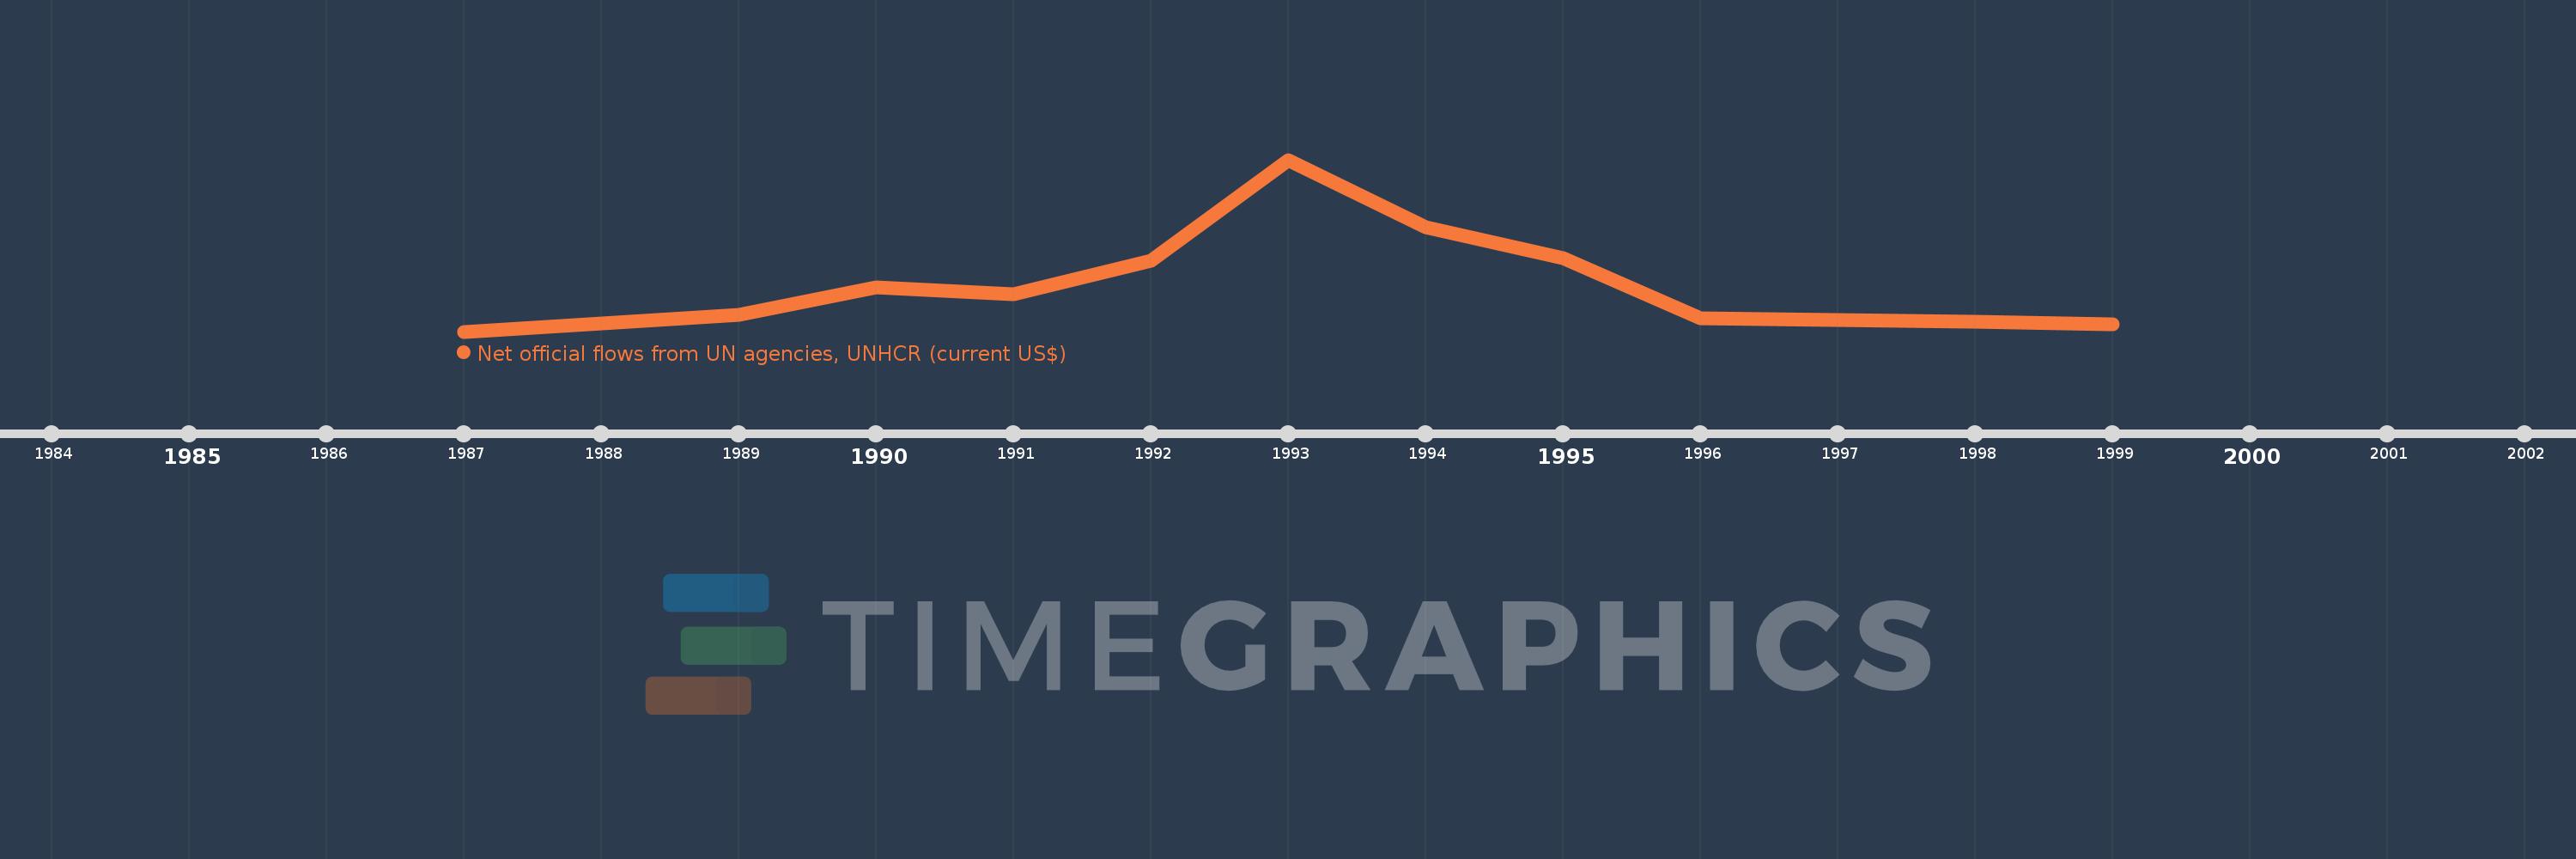
This timeline shows a graph from 1987 to 1999 of El Salvador. No data until 1986. Number of actual observations by date: 12.
Source name:
World Development Indicators
Source organization:
Development Assistance Committee of the Organisation for Economic Co-operation and Development, Geographical Distribution of Financial Flows to Developing Countries, Development Co-operation Report, and International Development Statistics database. Data are available online at: www.oecd.org/dac/stats/idsonline.
Categories, topics:
Aid Effectiveness
Last updated:
apr 23, 2017
Indicators value changes by year
Meaning:
1.027 mln
Minimum:
80.0K
jan 1, 1987
Maximum:
3.55 mln
jan 1, 1993
At the date of observation
Value
Absolute change
Change from the previous value
jan 1, 1987
80.0K
+80.0K
0.0%
jan 1, 1989
420.0K
+340.0K
425.0%
jan 1, 1990
980.0K
+560.0K
133.33%
jan 1, 1991
840.0K
-140.0K
-14.29%
jan 1, 1992
1.52 mln
+680.0K
80.95%
jan 1, 1993
3.55 mln
+2.03 mln
133.55%
jan 1, 1994
2.19 mln
-1.36 mln
-38.31%
jan 1, 1995
1.57 mln
-620.0K
-28.31%
jan 1, 1996
350.0K
-1.22 mln
-77.71%
jan 1, 1997
310.0K
-40.0K
-11.43%
jan 1, 1998
280.0K
-30.0K
-9.68%
jan 1, 1999
230.0K
-50.0K
-17.86%
Ranking of countries by current statistics by years