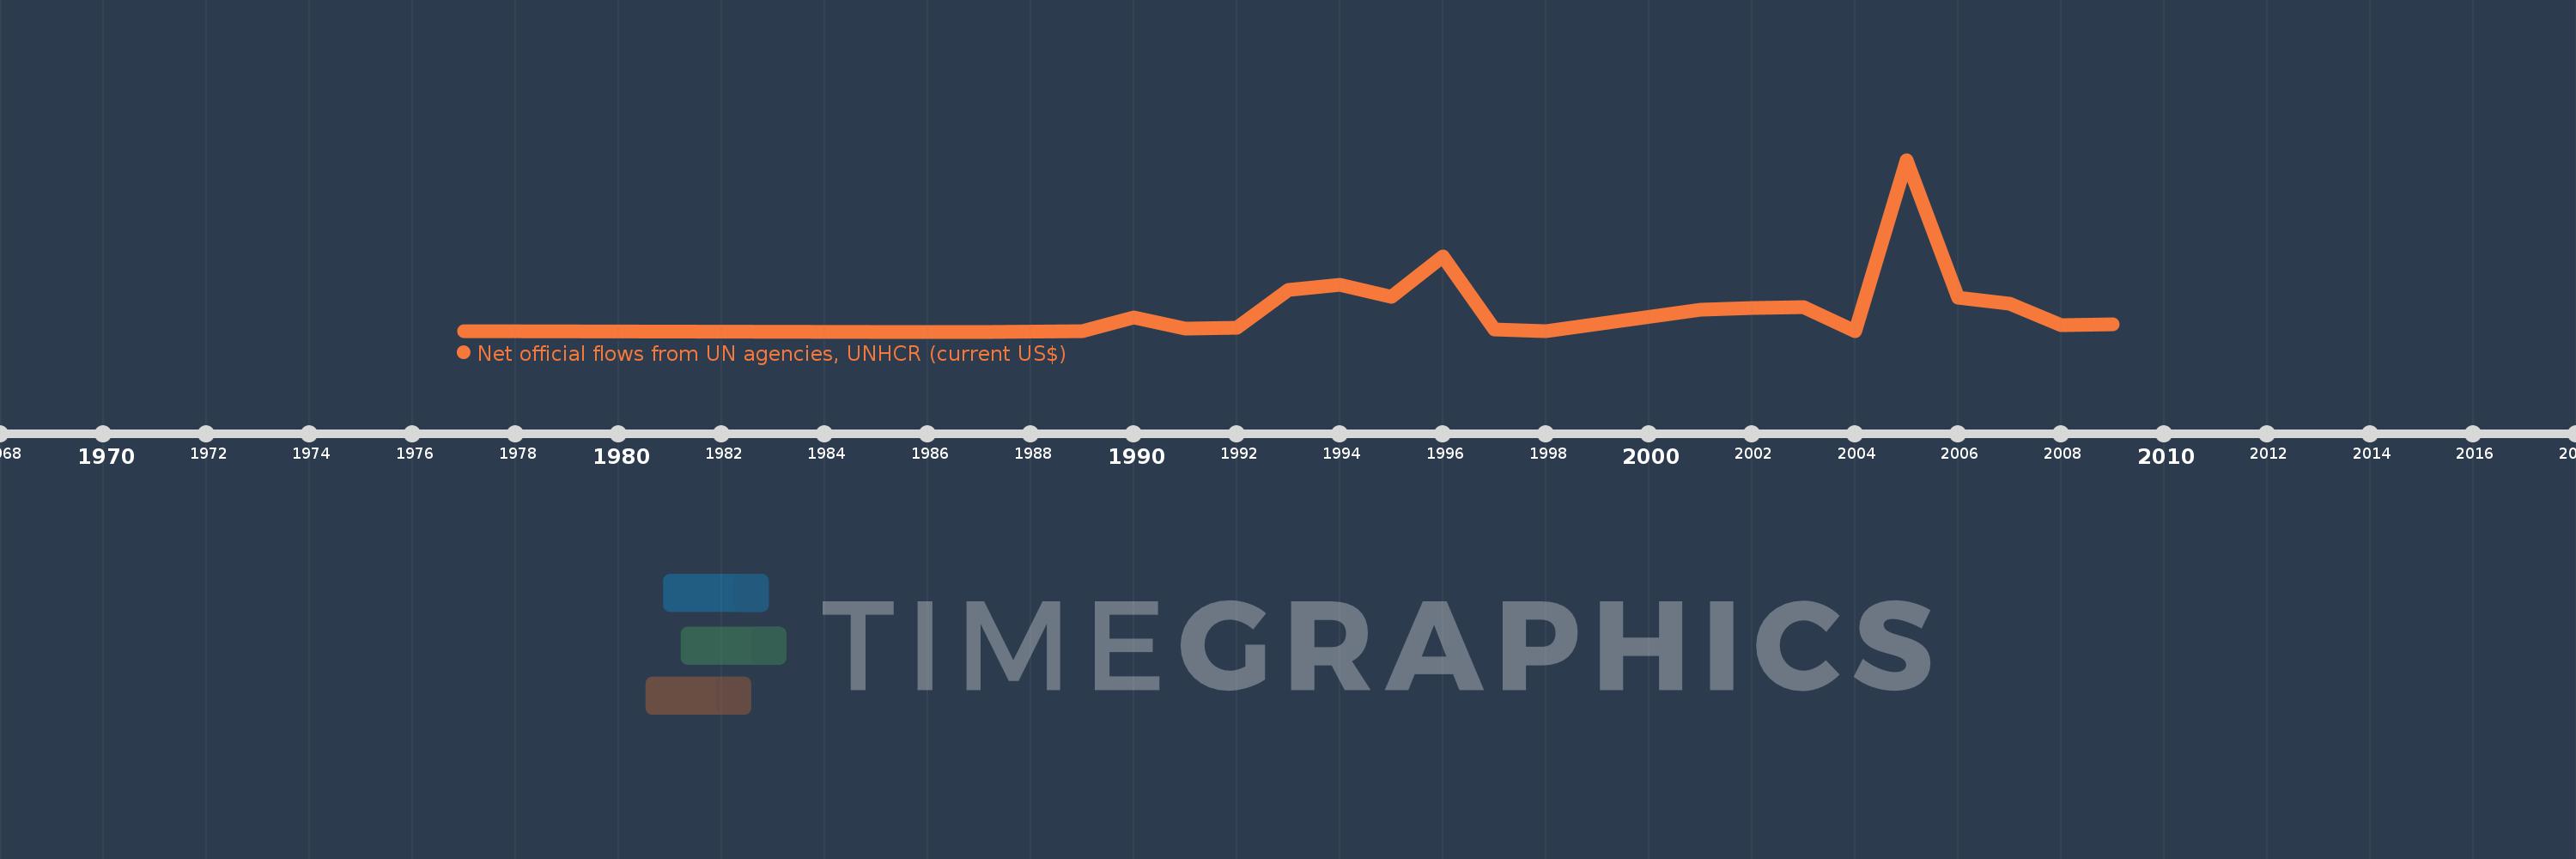
This timeline shows a graph from 1977 to 2009 of Afghanistan. No data until 1976. Number of actual observations by date: 22.
Source name:
World Development Indicators
Source organization:
Development Assistance Committee of the Organisation for Economic Co-operation and Development, Geographical Distribution of Financial Flows to Developing Countries, Development Co-operation Report, and International Development Statistics database. Data are available online at: www.oecd.org/dac/stats/idsonline.
Categories, topics:
Aid Effectiveness
Last updated:
apr 23, 2017
Indicators value changes by year
Meaning:
6.563 mln
Minimum:
10.0K
jan 1, 1986
Maximum:
45.61 mln
jan 1, 2005
At the date of observation
Value
Absolute change
Change from the previous value
jan 1, 1977
20.0K
+20.0K
0.0%
jan 1, 1986
10.0K
-10.0K
-50.0%
jan 1, 1987
10.0K
0.0
0.0%
jan 1, 1989
100.0K
+90.0K
900.0%
jan 1, 1990
3.85 mln
+3.75 mln
3.75K%
jan 1, 1991
900.0K
-2.95 mln
-76.62%
jan 1, 1992
1.06 mln
+160.0K
17.78%
jan 1, 1993
11.07 mln
+10.01 mln
944.34%
jan 1, 1994
12.47 mln
+1.4 mln
12.65%
jan 1, 1995
9.33 mln
-3.14 mln
-25.18%
jan 1, 1996
20.03 mln
+10.7 mln
114.68%
jan 1, 1997
490.0K
-19.54 mln
-97.55%
jan 1, 1998
220.0K
-270.0K
-55.1%
jan 1, 2001
5.77 mln
+5.55 mln
2.52K%
jan 1, 2002
6.38 mln
+610.0K
10.57%
jan 1, 2003
6.47 mln
+90.0K
1.41%
jan 1, 2004
230.0K
-6.24 mln
-96.45%
jan 1, 2005
45.61 mln
+45.38 mln
19.73K%
jan 1, 2006
9.12 mln
-36.49 mln
-80.0%
jan 1, 2007
7.49 mln
-1.63 mln
-17.87%
jan 1, 2008
1.72 mln
-5.77 mln
-77.04%
jan 1, 2009
2.04 mln
+320.0K
18.6%
Ranking of countries by current statistics by years