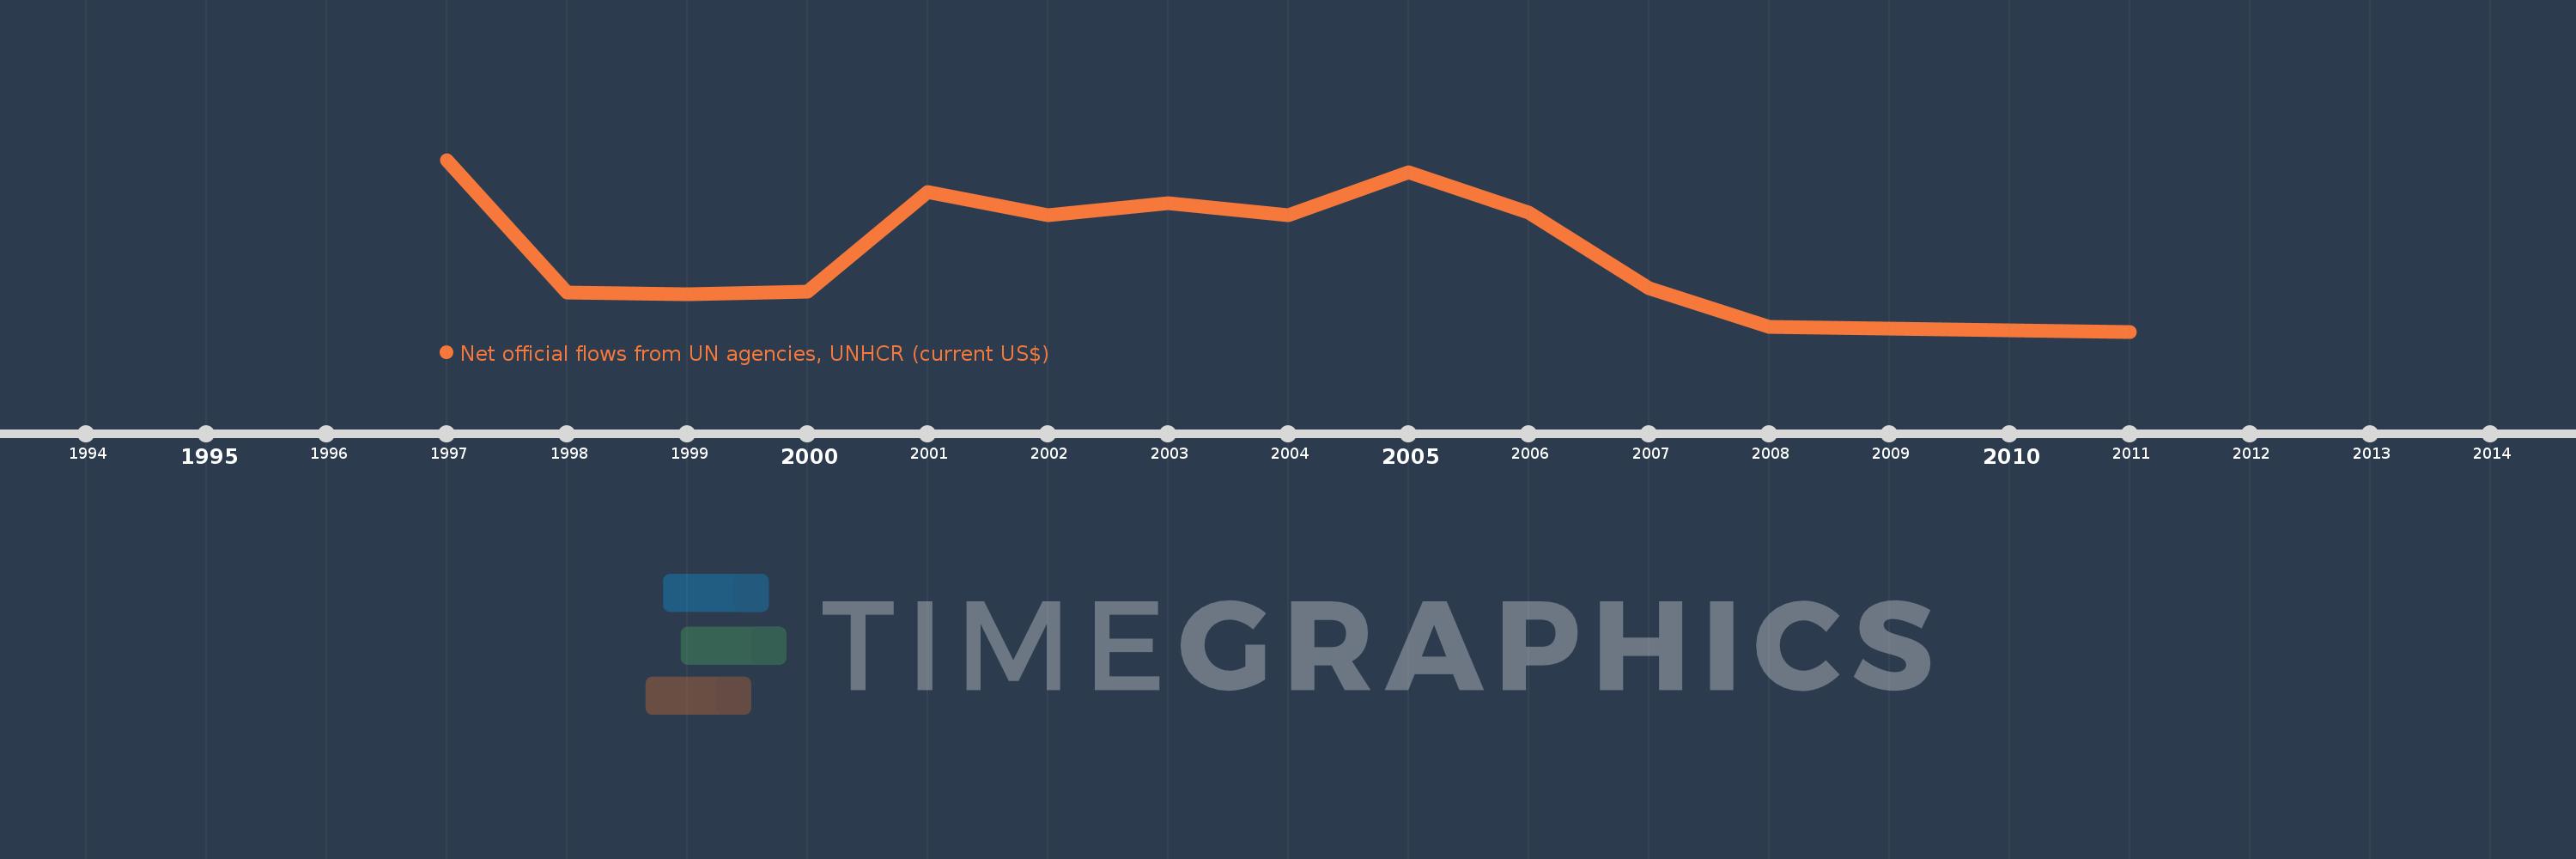
This timeline shows a graph from 1997 to 2011 of Uzbekistan. No data until 1996. Number of actual observations by date: 15.
Source name:
World Development Indicators
Source organization:
Development Assistance Committee of the Organisation for Economic Co-operation and Development, Geographical Distribution of Financial Flows to Developing Countries, Development Co-operation Report, and International Development Statistics database. Data are available online at: www.oecd.org/dac/stats/idsonline.
Categories, topics:
Aid Effectiveness
Last updated:
apr 23, 2017
Indicators value changes by year
Meaning:
522.0K
Minimum:
40.0K
jan 1, 2011
Maximum:
1.15 mln
jan 1, 1997
At the date of observation
Value
Absolute change
Change from the previous value
jan 1, 1997
1.15 mln
+1.15 mln
0.0%
jan 1, 1998
290.0K
-860.0K
-74.78%
jan 1, 1999
280.0K
-10.0K
-3.45%
jan 1, 2000
300.0K
+20.0K
7.14%
jan 1, 2001
940.0K
+640.0K
213.33%
jan 1, 2002
790.0K
-150.0K
-15.96%
jan 1, 2003
870.0K
+80.0K
10.13%
jan 1, 2004
790.0K
-80.0K
-9.2%
jan 1, 2005
1.07 mln
+280.0K
35.44%
jan 1, 2006
810.0K
-260.0K
-24.3%
jan 1, 2007
320.0K
-490.0K
-60.49%
jan 1, 2008
70.0K
-250.0K
-78.13%
jan 1, 2009
60.0K
-10.0K
-14.29%
jan 1, 2010
50.0K
-10.0K
-16.67%
jan 1, 2011
40.0K
-10.0K
-20.0%
Ranking of countries by current statistics by years