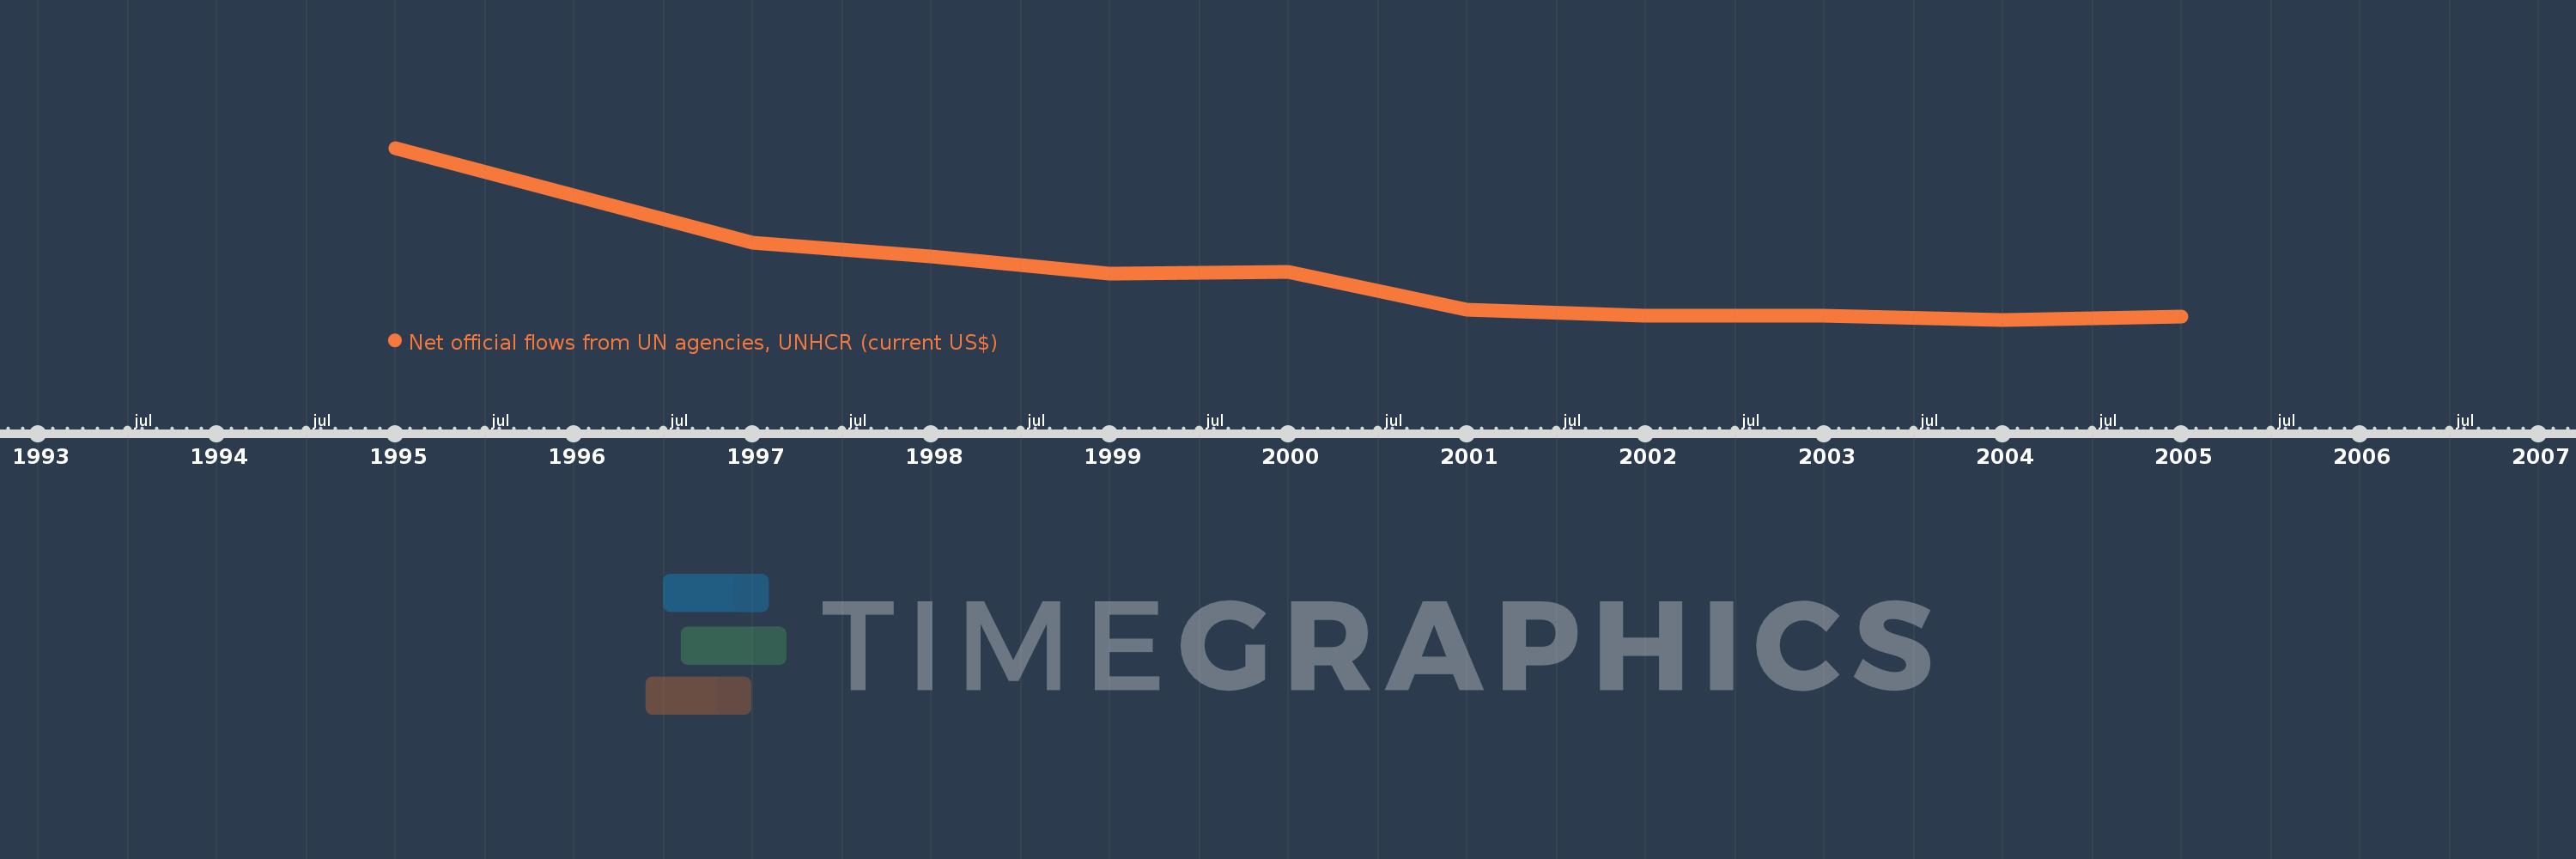
This timeline shows a graph from 1995 to 2005 of Slovenia. No data until 1994. Number of actual observations by date: 10.
Source name:
World Development Indicators
Source organization:
Development Assistance Committee of the Organisation for Economic Co-operation and Development, Geographical Distribution of Financial Flows to Developing Countries, Development Co-operation Report, and International Development Statistics database. Data are available online at: www.oecd.org/dac/stats/idsonline.
Categories, topics:
Aid Effectiveness
Last updated:
apr 23, 2017
Indicators value changes by year
Meaning:
1.529 mln
Minimum:
520.0K
jan 1, 2004
Maximum:
4.58 mln
jan 1, 1995
At the date of observation
Value
Absolute change
Change from the previous value
jan 1, 1995
4.58 mln
+4.58 mln
0.0%
jan 1, 1997
2.34 mln
-2.24 mln
-48.91%
jan 1, 1998
2.02 mln
-320.0K
-13.68%
jan 1, 1999
1.6 mln
-420.0K
-20.79%
jan 1, 2000
1.65 mln
+50.0K
3.13%
jan 1, 2001
760.0K
-890.0K
-53.94%
jan 1, 2002
610.0K
-150.0K
-19.74%
jan 1, 2003
620.0K
+10.0K
1.64%
jan 1, 2004
520.0K
-100.0K
-16.13%
jan 1, 2005
590.0K
+70.0K
13.46%
Ranking of countries by current statistics by years