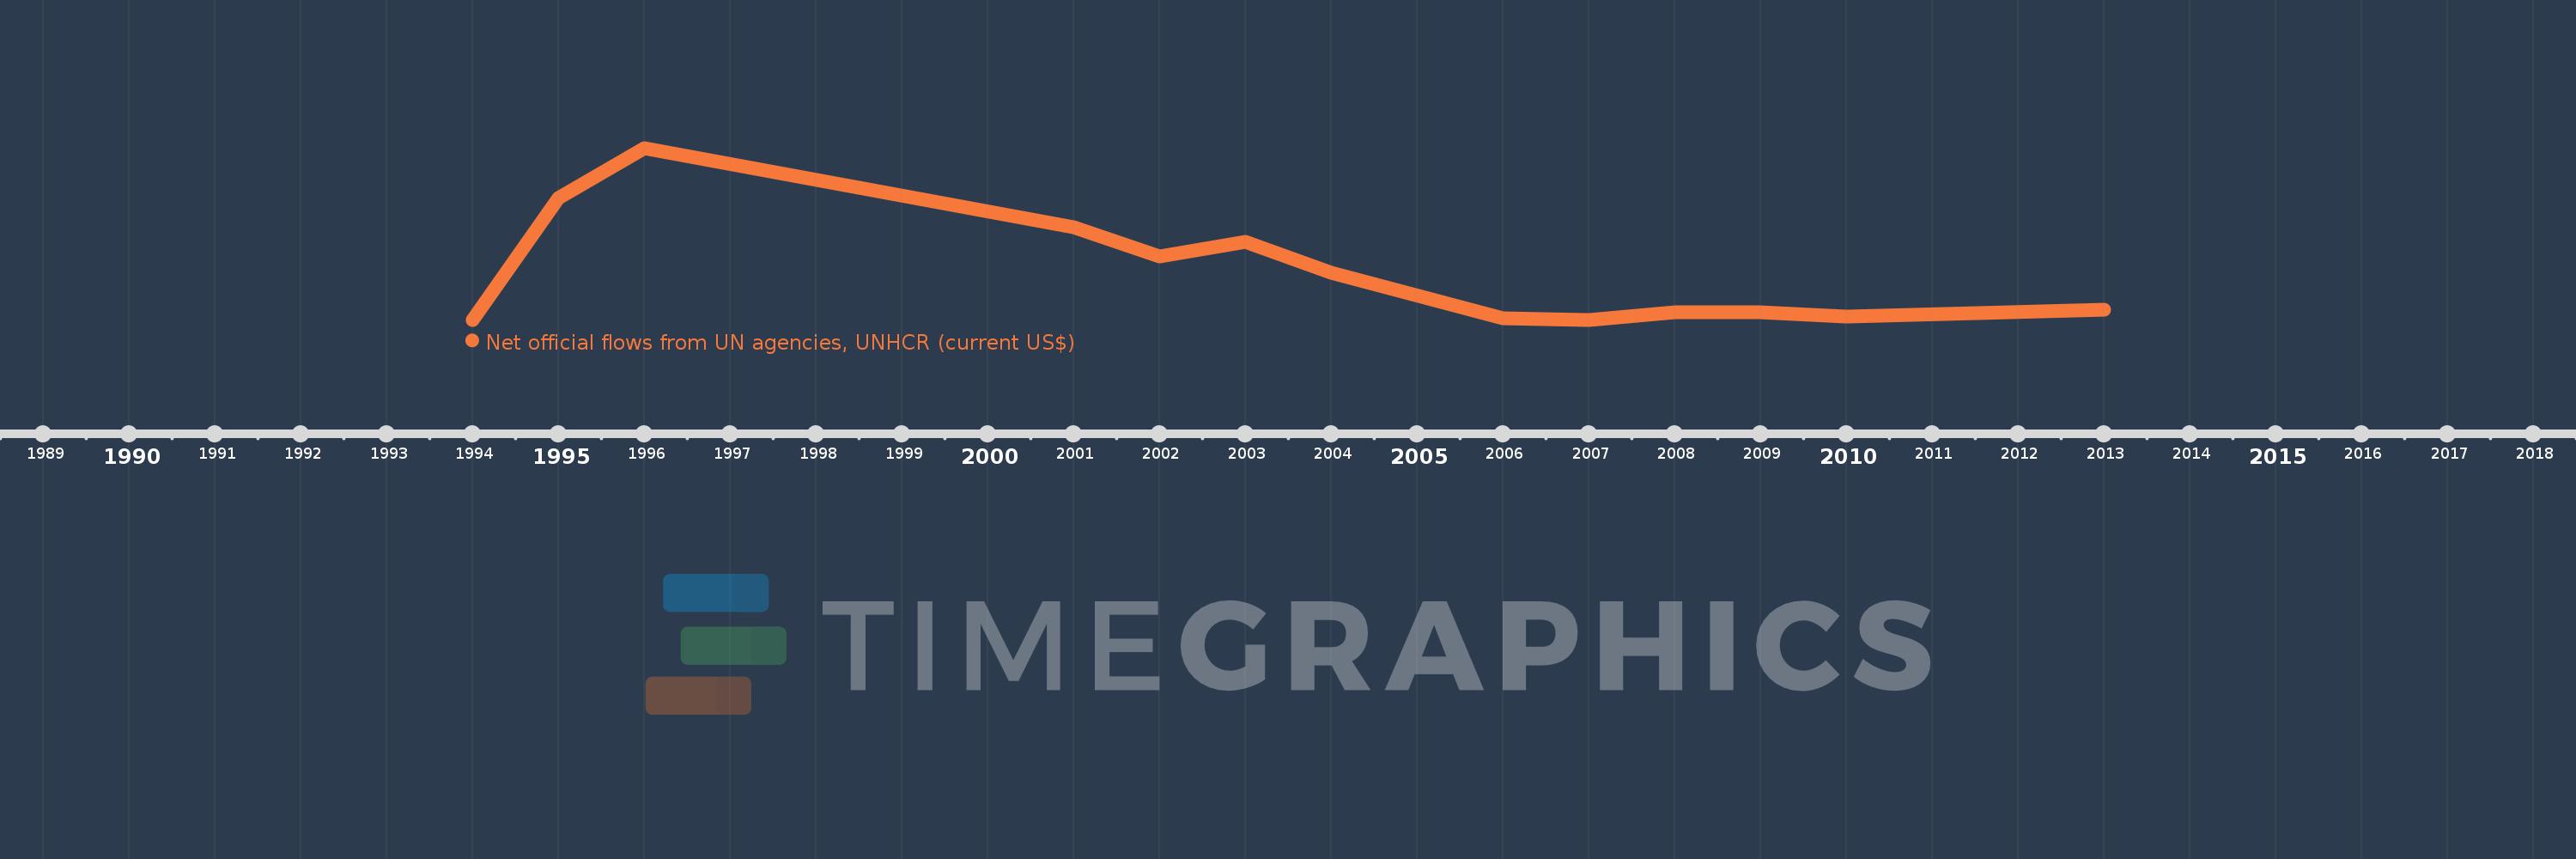
This timeline shows a graph from 1994 to 2013 of Myanmar. No data until 1993. Number of actual observations by date: 13.
Source name:
World Development Indicators
Source organization:
Development Assistance Committee of the Organisation for Economic Co-operation and Development, Geographical Distribution of Financial Flows to Developing Countries, Development Co-operation Report, and International Development Statistics database. Data are available online at: www.oecd.org/dac/stats/idsonline.
Categories, topics:
Aid Effectiveness
Last updated:
apr 23, 2017
Indicators value changes by year
Meaning:
3.233 mln
Minimum:
150.0K
jan 1, 1994
Maximum:
11.52 mln
jan 1, 1996
At the date of observation
Value
Absolute change
Change from the previous value
jan 1, 1994
150.0K
+150.0K
0.0%
jan 1, 1995
8.23 mln
+8.08 mln
5.39K%
jan 1, 1996
11.52 mln
+3.29 mln
39.98%
jan 1, 2001
6.3 mln
-5.22 mln
-45.31%
jan 1, 2002
4.36 mln
-1.94 mln
-30.79%
jan 1, 2003
5.32 mln
+960.0K
22.02%
jan 1, 2004
3.28 mln
-2.04 mln
-38.35%
jan 1, 2006
240.0K
-3.04 mln
-92.68%
jan 1, 2007
160.0K
-80.0K
-33.33%
jan 1, 2008
650.0K
+490.0K
306.25%
jan 1, 2009
620.0K
-30.0K
-4.62%
jan 1, 2010
380.0K
-240.0K
-38.71%
jan 1, 2013
820.0K
+440.0K
115.79%
Ranking of countries by current statistics by years