33
/
AIzaSyAYiBZKx7MnpbEhh9jyipgxe19OcubqV5w
August 1, 2025
249140
Sri Lanka
LKA
true
2
1
Net official flows from UN agencies, UNHCR (current US$)
2013,2009,2008,2007,2006,2004,2003,2002,2001,2000,1999,1998,1997,1996,1995,1994,1993,1992,1991,1990,1989
Download
Global statistics library →Sri Lanka →

Net official flows from UN agencies, UNHCR (current US$)

This statistics in other country:

AfghanistanAlbaniaAlgeriaAngolaArab WorldArgentinaArmeniaAzerbaijanBahrainBangladeshBelarusBelizeBeninBoliviaBosnia and HerzegovinaBotswanaBrazilBulgariaBurkina FasoBurundiCabo VerdeCambodiaCameroonCaribbean small statesCentral African RepublicCentral Europe and the BalticsChadChileChinaColombiaComorosCongo, Dem. Rep.Congo, Rep.Costa RicaCote d'IvoireCroatiaCubaCyprusCzech RepublicDjiboutiDominican RepublicEast Asia & PacificEast Asia & Pacific (excluding high income)East Asia & Pacific (IDA & IBRD countries)EcuadorEgypt, Arab Rep.El SalvadorEquatorial GuineaEritreaEthiopiaEuro areaEurope & Central AsiaEurope & Central Asia (excluding high income)Europe & Central Asia (IDA & IBRD countries)European UnionFragile and conflict affected situationsGabonGambia, TheGeorgiaGhanaGuatemalaGuineaGuinea-BissauHaitiHeavily indebted poor countries (HIPC)High incomeHondurasHong Kong SAR, ChinaHungaryIBRD onlyIDA & IBRD totalIDA blendIDA onlyIDA totalIndiaIndonesiaIran, Islamic Rep.IraqIsraelJamaicaJordanKazakhstanKenyaKorea, Dem. People’s Rep.Korea, Rep.KosovoKuwaitKyrgyz RepublicLao PDRLatin America & Caribbean Latin America & Caribbean (excluding high income)Latin America & the Caribbean (IDA & IBRD countries)LatviaLeast developed countries: UN classificationLebanonLesothoLiberiaLibyaLow & middle incomeLow incomeLower middle incomeMacao SAR, ChinaMacedonia, FYRMadagascarMalawiMalaysiaMaliMaltaMauritaniaMexicoMiddle East & North AfricaMiddle East & North Africa (excluding high income)Middle East & North Africa (IDA & IBRD countries)Middle incomeMoldovaMongoliaMontenegroMoroccoMozambiqueMyanmarNamibiaNepalNicaraguaNigerNigeriaOECD membersOther small statesPakistanPanamaPapua New GuineaParaguayPeruPhilippinesPolandRomaniaRussian FederationRwandaSao Tome and PrincipeSaudi ArabiaSenegalSerbiaSierra LeoneSingaporeSlovak RepublicSloveniaSmall statesSomaliaSouth AfricaSouth AsiaSouth Asia (IDA & IBRD)South SudanSri LankaSub-Saharan Africa Sub-Saharan Africa (excluding high income)Sub-Saharan Africa (IDA & IBRD countries)SudanSurinameSwazilandSyrian Arab RepublicTajikistanTanzaniaThailandTimor-LesteTogoTunisiaTurkeyTurkmenistanUgandaUkraineUnited Arab EmiratesUpper middle incomeUruguayUzbekistanVenezuela, RBVietnamWorldYemen, Rep.ZambiaZimbabwe

Timeline:

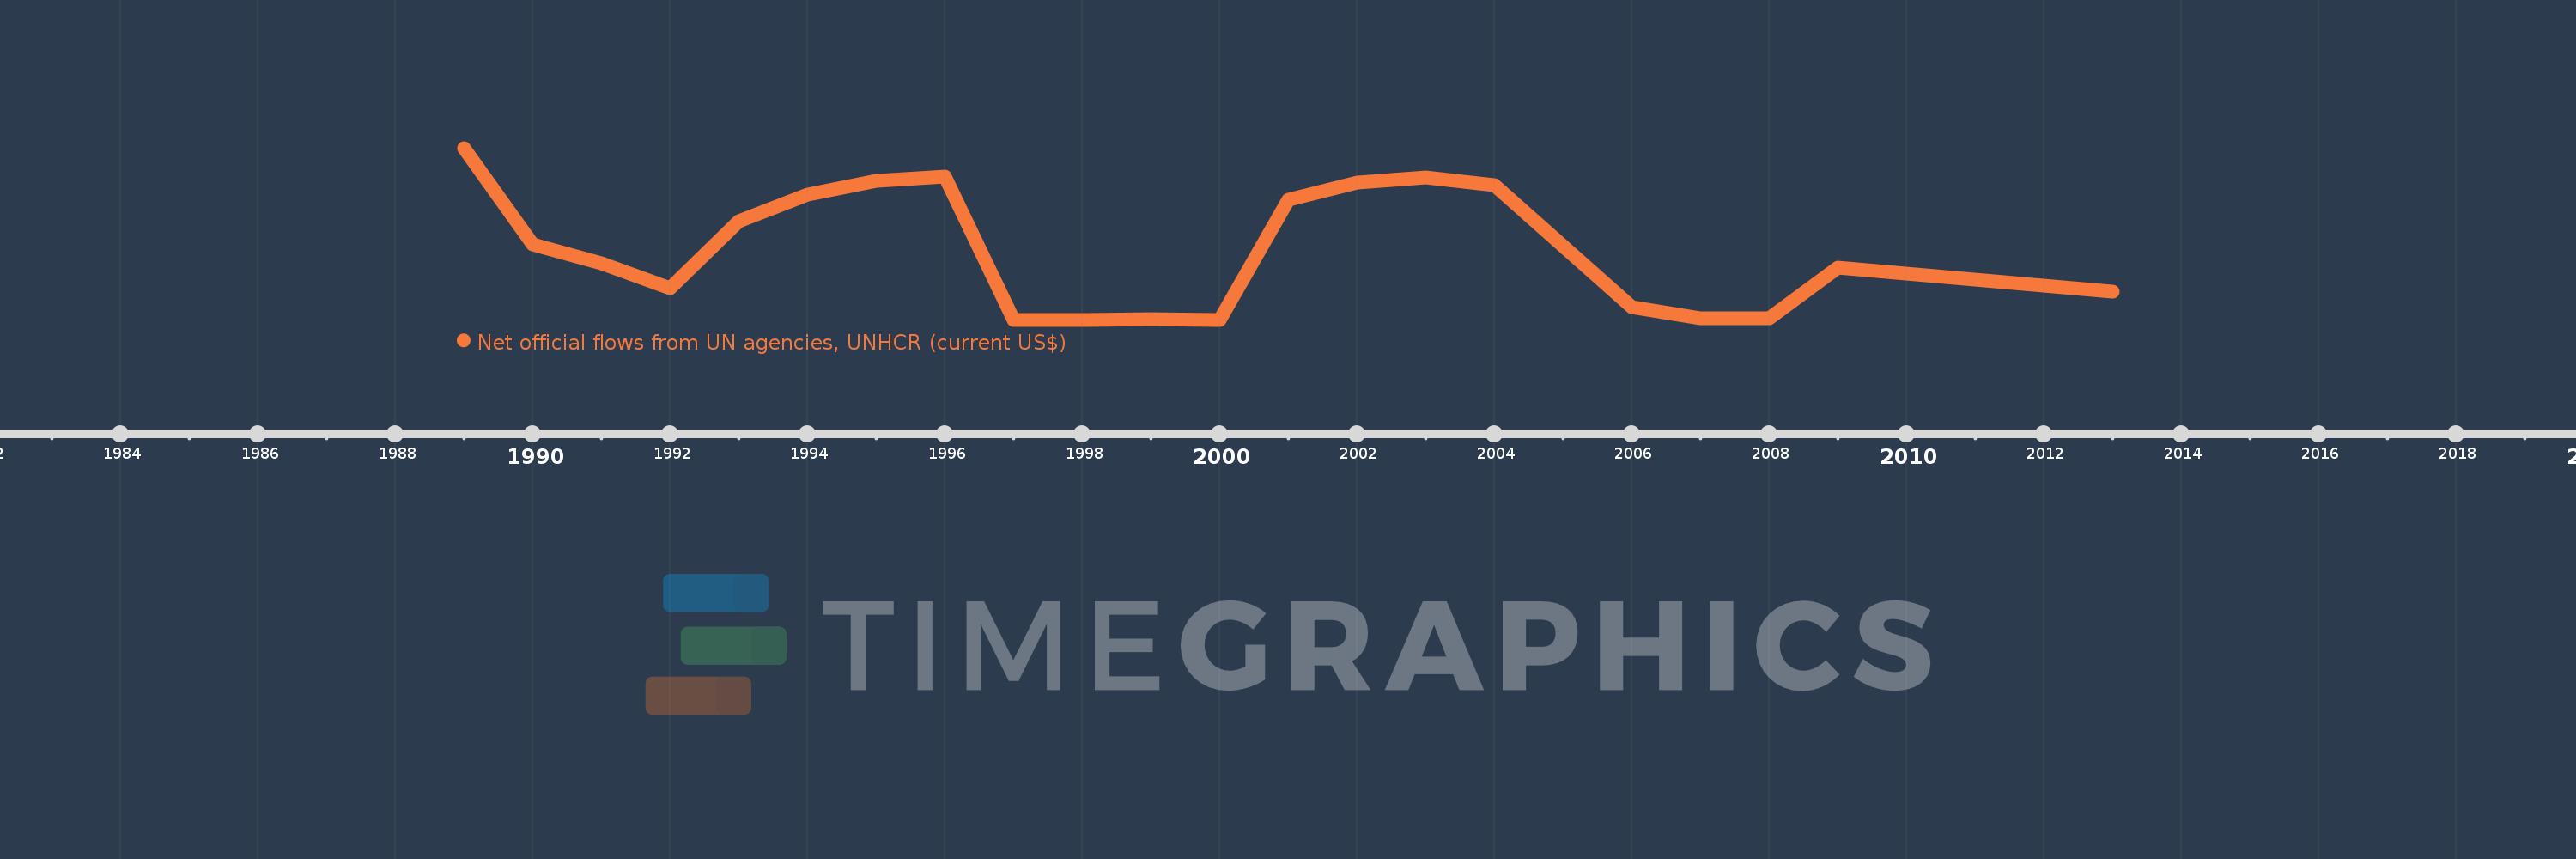
This timeline shows a graph from 1989 to 2013 of Sri Lanka. No data until 1988. Number of actual observations by date: 21.

Source name:

World Development Indicators

Source organization:

Development Assistance Committee of the Organisation for Economic Co-operation and Development, Geographical Distribution of Financial Flows to Developing Countries, Development Co-operation Report, and International Development Statistics database. Data are available online at: www.oecd.org/dac/stats/idsonline.

Categories, topics:

Aid Effectiveness

Last updated:

apr 23, 2017

Indicators value changes by year

Meaning:
2.665 mln
Minimum:
40.0K
jan 1, 1997
Maximum:
6.47 mln
jan 1, 1989
At the date of observation
Value
Absolute change
Change from the previous value
jan 1, 1989
6.47 mln
+6.47 mln
0.0%
jan 1, 1990
2.87 mln
-3.6 mln
-55.64%
jan 1, 1991
2.16 mln
-710.0K
-24.74%
jan 1, 1992
1.22 mln
-940.0K
-43.52%
jan 1, 1993
3.74 mln
+2.52 mln
206.56%
jan 1, 1994
4.74 mln
+1000.0K
26.74%
jan 1, 1995
5.23 mln
+490.0K
10.34%
jan 1, 1996
5.41 mln
+180.0K
3.44%
jan 1, 1997
40.0K
-5.37 mln
-99.26%
jan 1, 1998
40.0K
0.0
0.0%
jan 1, 1999
50.0K
+10.0K
25.0%
jan 1, 2000
40.0K
-10.0K
-20.0%
jan 1, 2001
4.53 mln
+4.49 mln
11.22K%
jan 1, 2002
5.19 mln
+660.0K
14.57%
jan 1, 2003
5.36 mln
+170.0K
3.28%
jan 1, 2004
5.09 mln
-270.0K
-5.04%
jan 1, 2006
500.0K
-4.59 mln
-90.18%
jan 1, 2007
100.0K
-400.0K
-80.0%
jan 1, 2008
110.0K
+10.0K
10.0%
jan 1, 2009
1.99 mln
+1.88 mln
1.71K%
jan 1, 2013
1.08 mln
-910.0K
-45.73%

Ranking of countries by current statistics by years