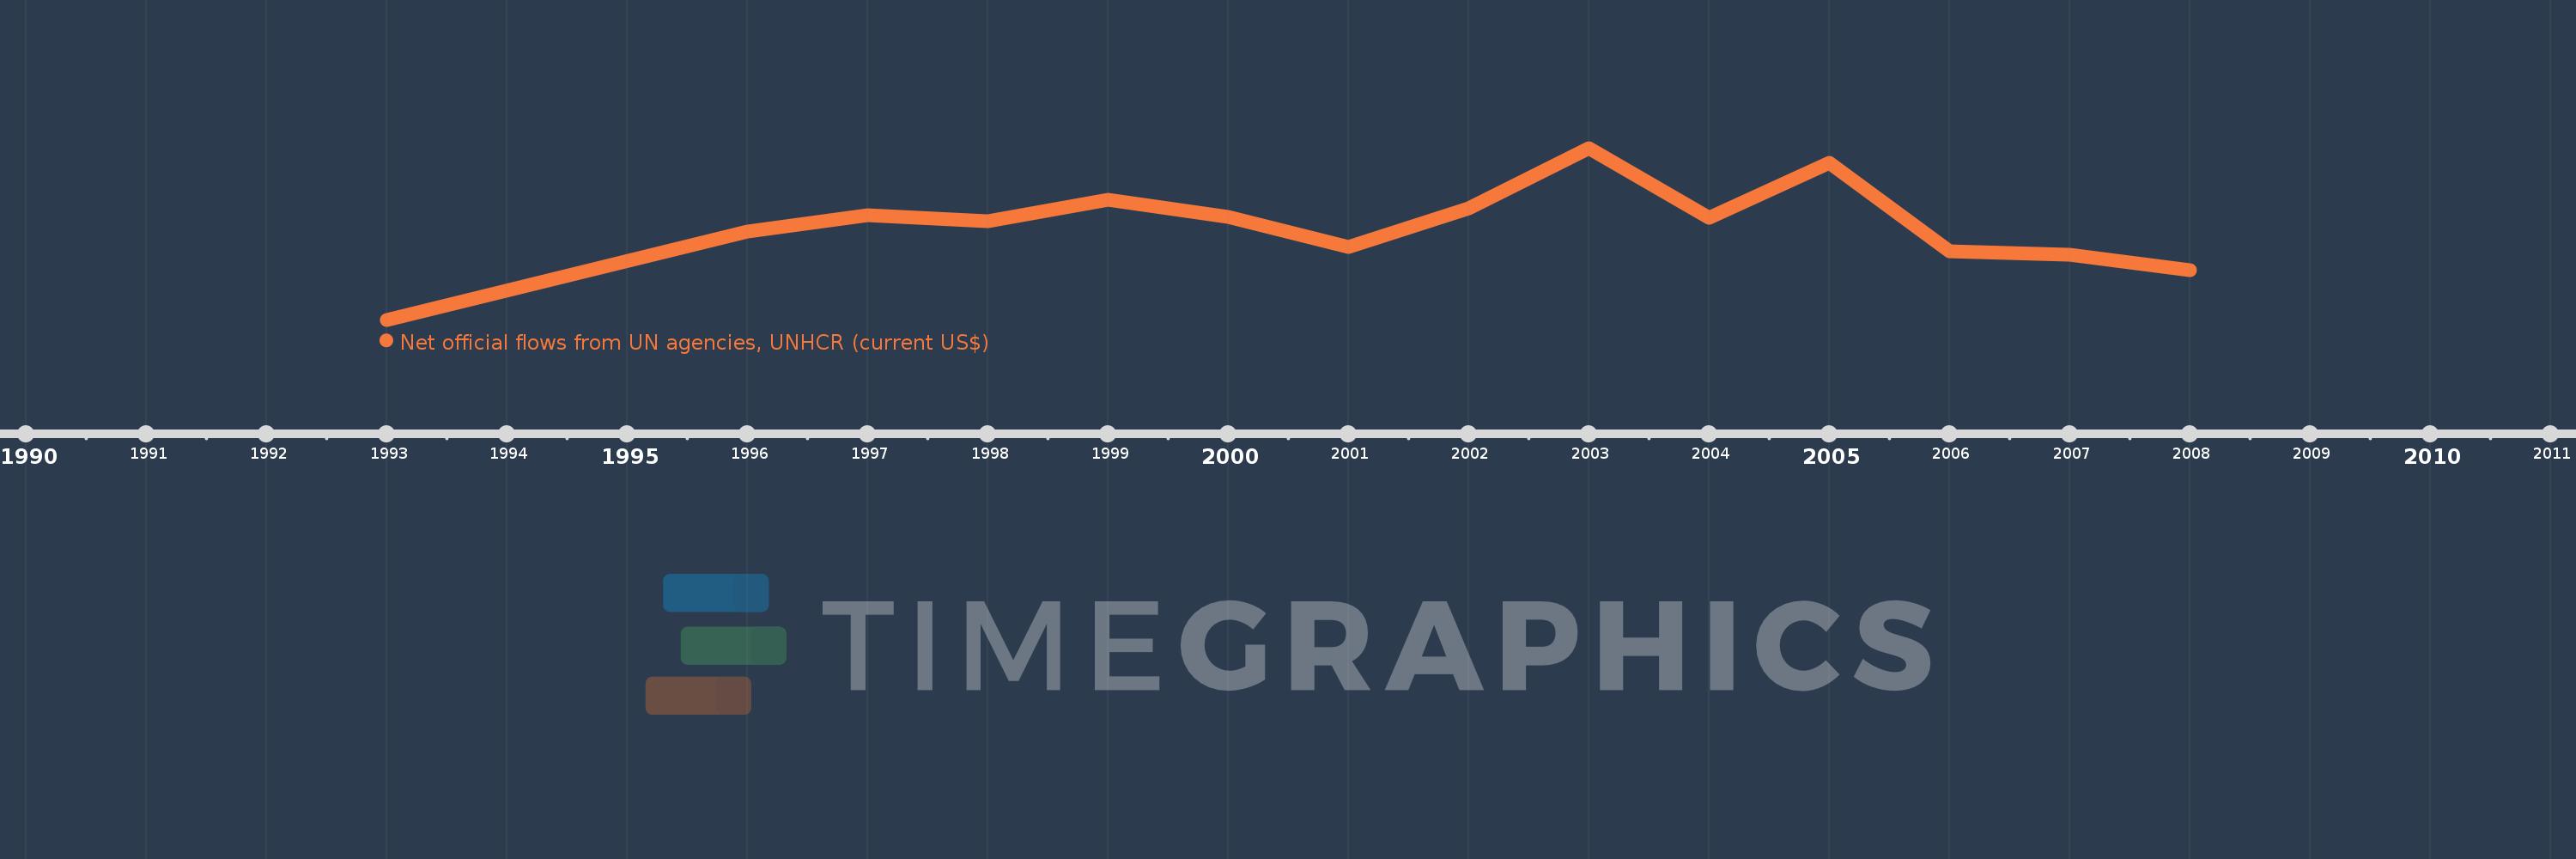
This timeline shows a graph from 1993 to 2008 of Saudi Arabia. No data until 1992. Number of actual observations by date: 14.
Source name:
World Development Indicators
Source organization:
Development Assistance Committee of the Organisation for Economic Co-operation and Development, Geographical Distribution of Financial Flows to Developing Countries, Development Co-operation Report, and International Development Statistics database. Data are available online at: www.oecd.org/dac/stats/idsonline.
Categories, topics:
Aid Effectiveness
Last updated:
apr 23, 2017
Indicators value changes by year
Meaning:
1.166 mln
Minimum:
300.0K
jan 1, 1993
Maximum:
1.89 mln
jan 1, 2003
At the date of observation
Value
Absolute change
Change from the previous value
jan 1, 1993
300.0K
+300.0K
0.0%
jan 1, 1996
1.12 mln
+820.0K
273.33%
jan 1, 1997
1.27 mln
+150.0K
13.39%
jan 1, 1998
1.21 mln
-60.0K
-4.72%
jan 1, 1999
1.41 mln
+200.0K
16.53%
jan 1, 2000
1.25 mln
-160.0K
-11.35%
jan 1, 2001
970.0K
-280.0K
-22.4%
jan 1, 2002
1.33 mln
+360.0K
37.11%
jan 1, 2003
1.89 mln
+560.0K
42.11%
jan 1, 2004
1.24 mln
-650.0K
-34.39%
jan 1, 2005
1.75 mln
+510.0K
41.13%
jan 1, 2006
930.0K
-820.0K
-46.86%
jan 1, 2007
900.0K
-30.0K
-3.23%
jan 1, 2008
760.0K
-140.0K
-15.56%
Ranking of countries by current statistics by years