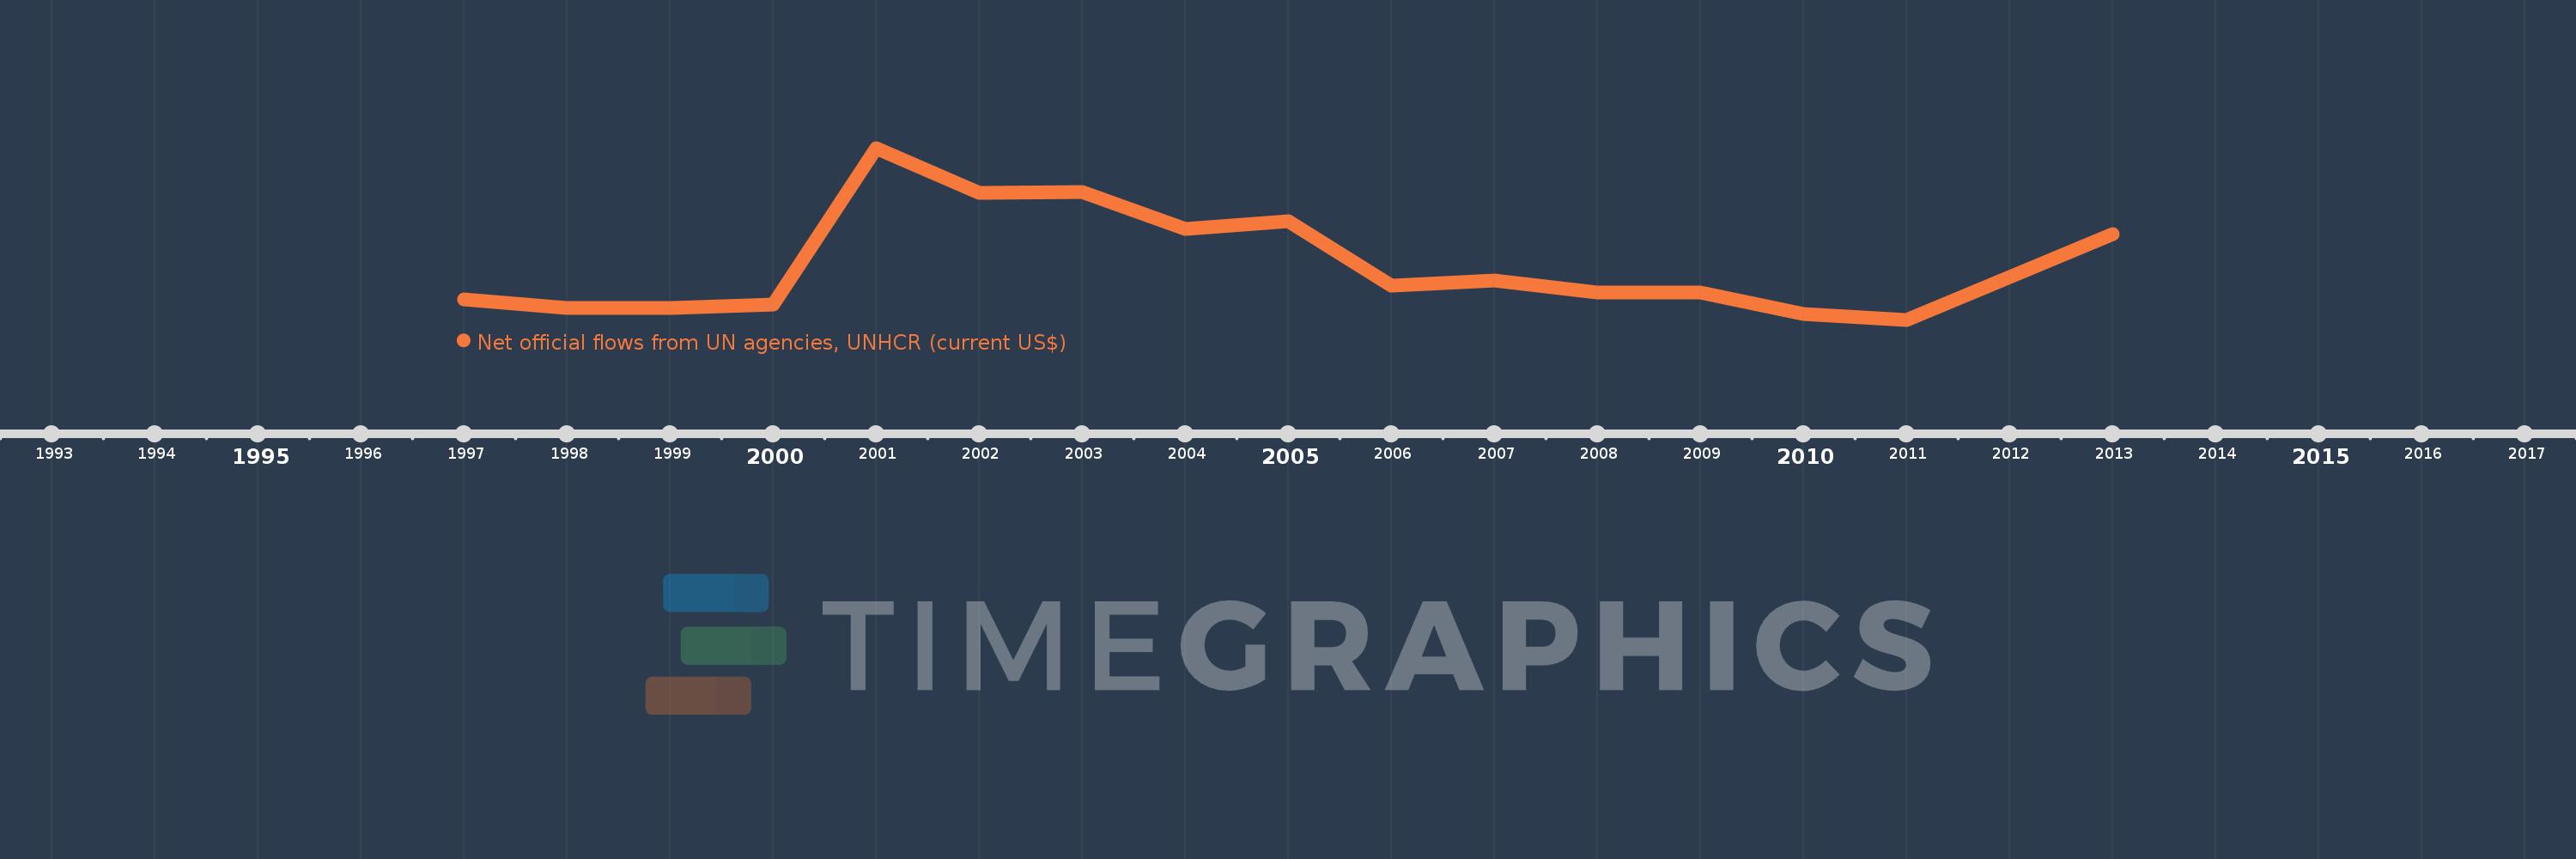
This timeline shows a graph from 1997 to 2013 of Tajikistan. No data until 1996. Number of actual observations by date: 16.
Source name:
World Development Indicators
Source organization:
Development Assistance Committee of the Organisation for Economic Co-operation and Development, Geographical Distribution of Financial Flows to Developing Countries, Development Co-operation Report, and International Development Statistics database. Data are available online at: www.oecd.org/dac/stats/idsonline.
Categories, topics:
Aid Effectiveness
Last updated:
apr 23, 2017
Indicators value changes by year
Meaning:
738.75K
Minimum:
130.0K
jan 1, 2011
Maximum:
2.0 mln
jan 1, 2001
At the date of observation
Value
Absolute change
Change from the previous value
jan 1, 1997
350.0K
+350.0K
0.0%
jan 1, 1998
260.0K
-90.0K
-25.71%
jan 1, 1999
260.0K
0.0
0.0%
jan 1, 2000
300.0K
+40.0K
15.38%
jan 1, 2001
2.0 mln
+1.7 mln
566.67%
jan 1, 2002
1.51 mln
-490.0K
-24.5%
jan 1, 2003
1.52 mln
+10.0K
0.66%
jan 1, 2004
1.12 mln
-400.0K
-26.32%
jan 1, 2005
1.2 mln
+80.0K
7.14%
jan 1, 2006
500.0K
-700.0K
-58.33%
jan 1, 2007
560.0K
+60.0K
12.0%
jan 1, 2008
430.0K
-130.0K
-23.21%
jan 1, 2009
430.0K
0.0
0.0%
jan 1, 2010
190.0K
-240.0K
-55.81%
jan 1, 2011
130.0K
-60.0K
-31.58%
jan 1, 2013
1.06 mln
+930.0K
715.38%
Ranking of countries by current statistics by years