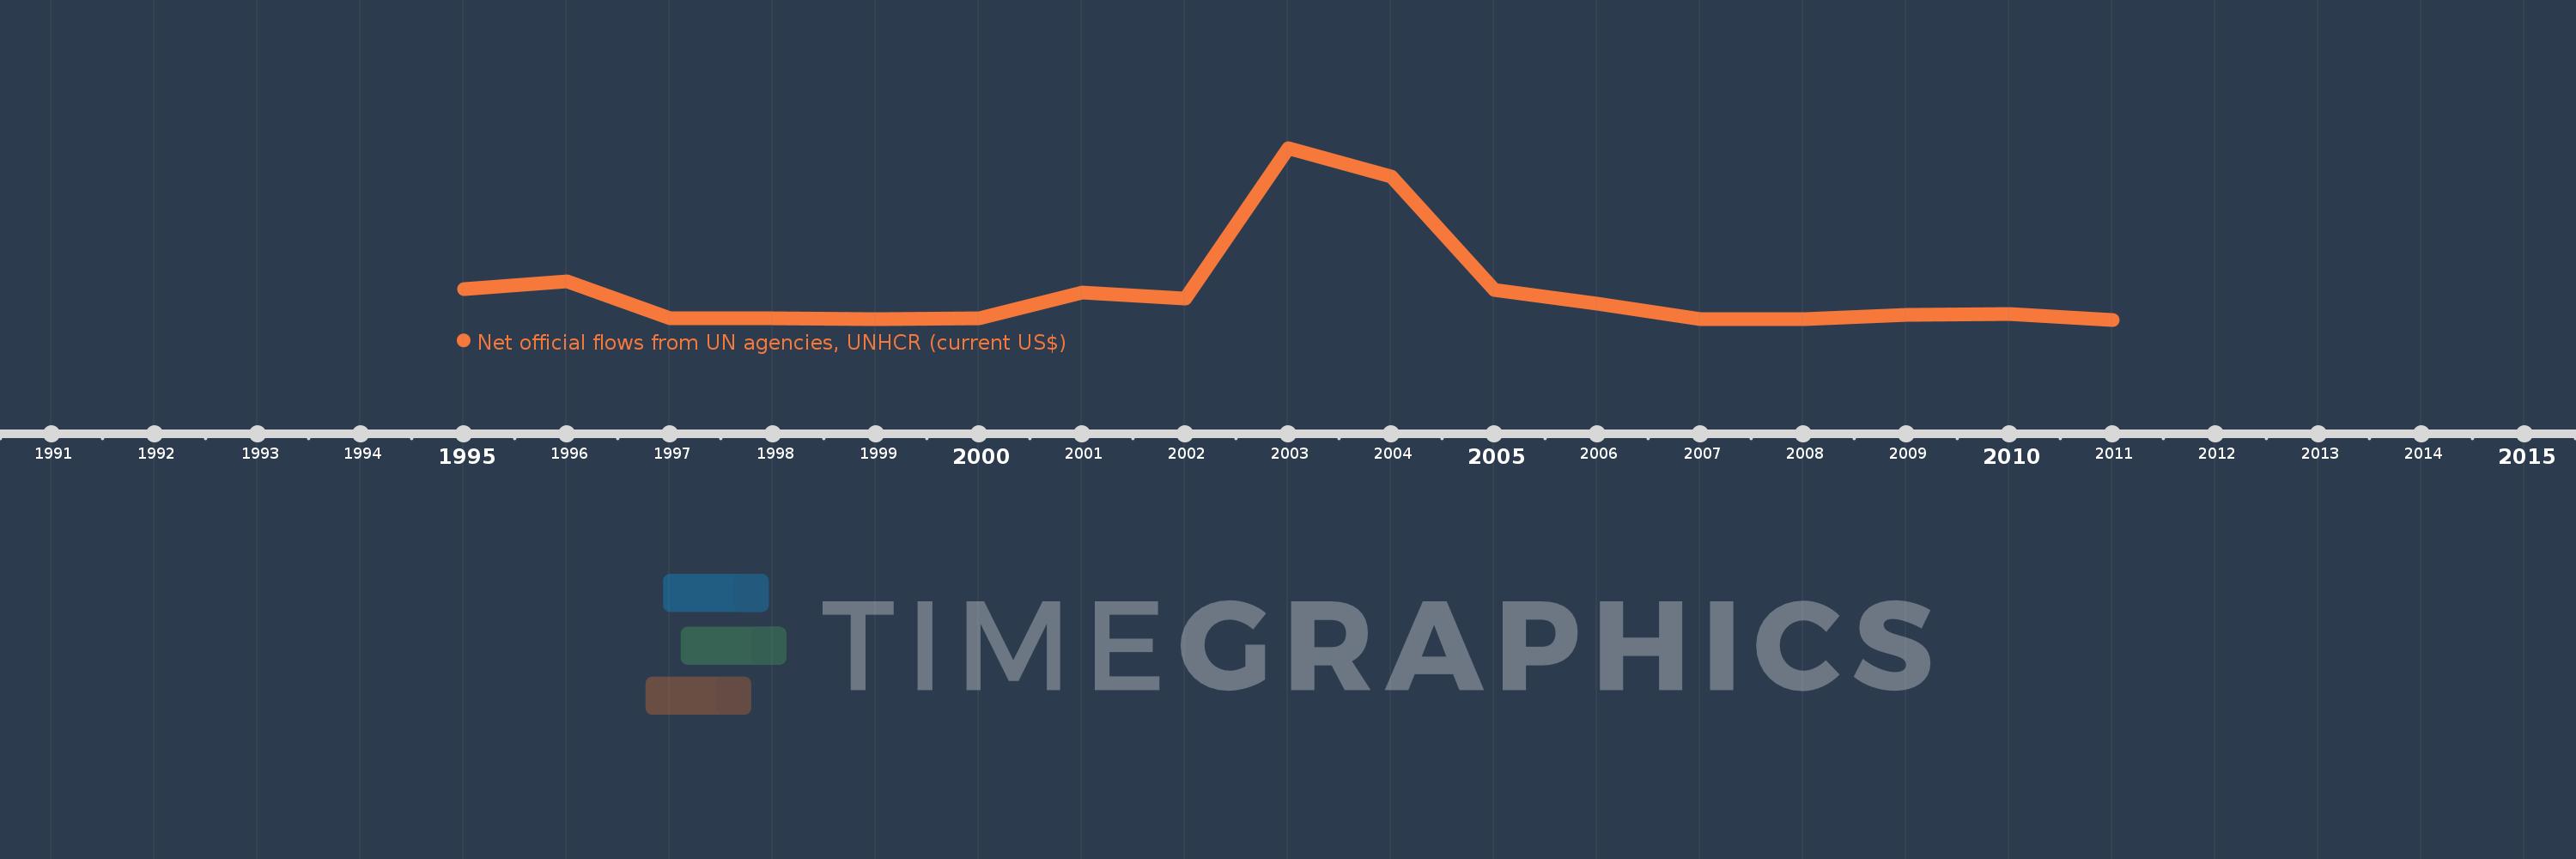
This timeline shows a graph from 1995 to 2011 of Eritrea. No data until 1994. Number of actual observations by date: 17.
Source name:
World Development Indicators
Source organization:
Development Assistance Committee of the Organisation for Economic Co-operation and Development, Geographical Distribution of Financial Flows to Developing Countries, Development Co-operation Report, and International Development Statistics database. Data are available online at: www.oecd.org/dac/stats/idsonline.
Categories, topics:
Aid Effectiveness
Last updated:
apr 23, 2017
Indicators value changes by year
Meaning:
3.214 mln
Minimum:
620.0K
jan 1, 2011
Maximum:
15.95 mln
jan 1, 2003
At the date of observation
Value
Absolute change
Change from the previous value
jan 1, 1995
3.32 mln
+3.32 mln
0.0%
jan 1, 1996
4.03 mln
+710.0K
21.39%
jan 1, 1997
720.0K
-3.31 mln
-82.13%
jan 1, 1998
780.0K
+60.0K
8.33%
jan 1, 1999
690.0K
-90.0K
-11.54%
jan 1, 2000
750.0K
+60.0K
8.7%
jan 1, 2001
3.02 mln
+2.27 mln
302.67%
jan 1, 2002
2.52 mln
-500.0K
-16.56%
jan 1, 2003
15.95 mln
+13.43 mln
532.94%
jan 1, 2004
13.38 mln
-2.57 mln
-16.11%
jan 1, 2005
3.3 mln
-10.08 mln
-75.34%
jan 1, 2006
2.07 mln
-1.23 mln
-37.27%
jan 1, 2007
640.0K
-1.43 mln
-69.08%
jan 1, 2008
640.0K
0.0
0.0%
jan 1, 2009
1.04 mln
+400.0K
62.5%
jan 1, 2010
1.16 mln
+120.0K
11.54%
jan 1, 2011
620.0K
-540.0K
-46.55%
Ranking of countries by current statistics by years