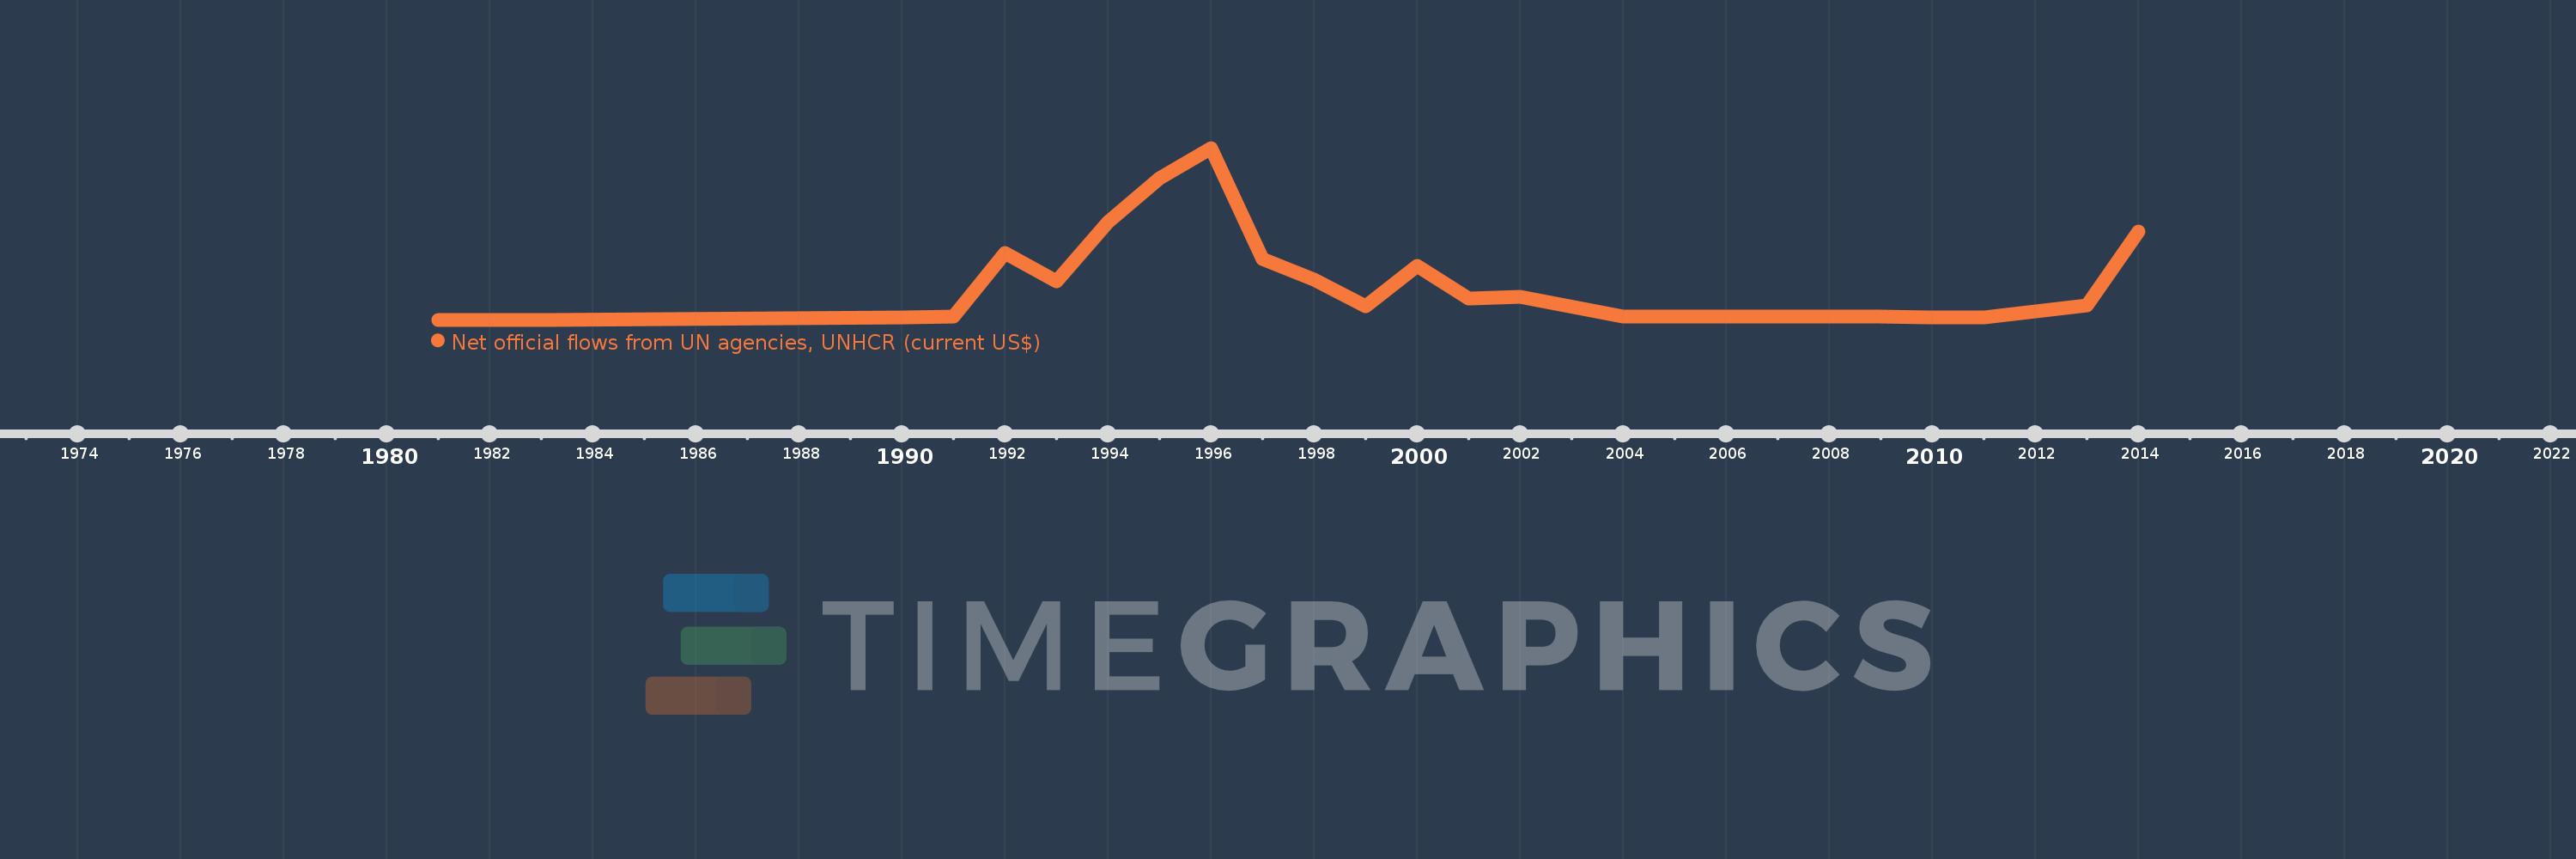
This timeline shows a graph from 1981 to 2014 of Mali. No data until 1980. Number of actual observations by date: 21.
Source name:
World Development Indicators
Source organization:
Development Assistance Committee of the Organisation for Economic Co-operation and Development, Geographical Distribution of Financial Flows to Developing Countries, Development Co-operation Report, and International Development Statistics database. Data are available online at: www.oecd.org/dac/stats/idsonline.
Categories, topics:
Aid Effectiveness
Last updated:
apr 23, 2017
Indicators value changes by year
Meaning:
430.952K
Minimum:
10.0K
jan 1, 1981
Maximum:
1.81 mln
jan 1, 1996
At the date of observation
Value
Absolute change
Change from the previous value
jan 1, 1981
10.0K
+10.0K
0.0%
jan 1, 1983
10.0K
0.0
0.0%
jan 1, 1990
30.0K
+20.0K
200.0%
jan 1, 1991
40.0K
+10.0K
33.33%
jan 1, 1992
710.0K
+670.0K
1.68K%
jan 1, 1993
410.0K
-300.0K
-42.25%
jan 1, 1994
1.03 mln
+620.0K
151.22%
jan 1, 1995
1.49 mln
+460.0K
44.66%
jan 1, 1996
1.81 mln
+320.0K
21.48%
jan 1, 1997
650.0K
-1.16 mln
-64.09%
jan 1, 1998
430.0K
-220.0K
-33.85%
jan 1, 1999
150.0K
-280.0K
-65.12%
jan 1, 2000
570.0K
+420.0K
280.0%
jan 1, 2001
230.0K
-340.0K
-59.65%
jan 1, 2002
250.0K
+20.0K
8.7%
jan 1, 2004
40.0K
-210.0K
-84.0%
jan 1, 2009
40.0K
0.0
0.0%
jan 1, 2010
30.0K
-10.0K
-25.0%
jan 1, 2011
30.0K
0.0
0.0%
jan 1, 2013
160.0K
+130.0K
433.33%
jan 1, 2014
930.0K
+770.0K
481.25%
Ranking of countries by current statistics by years