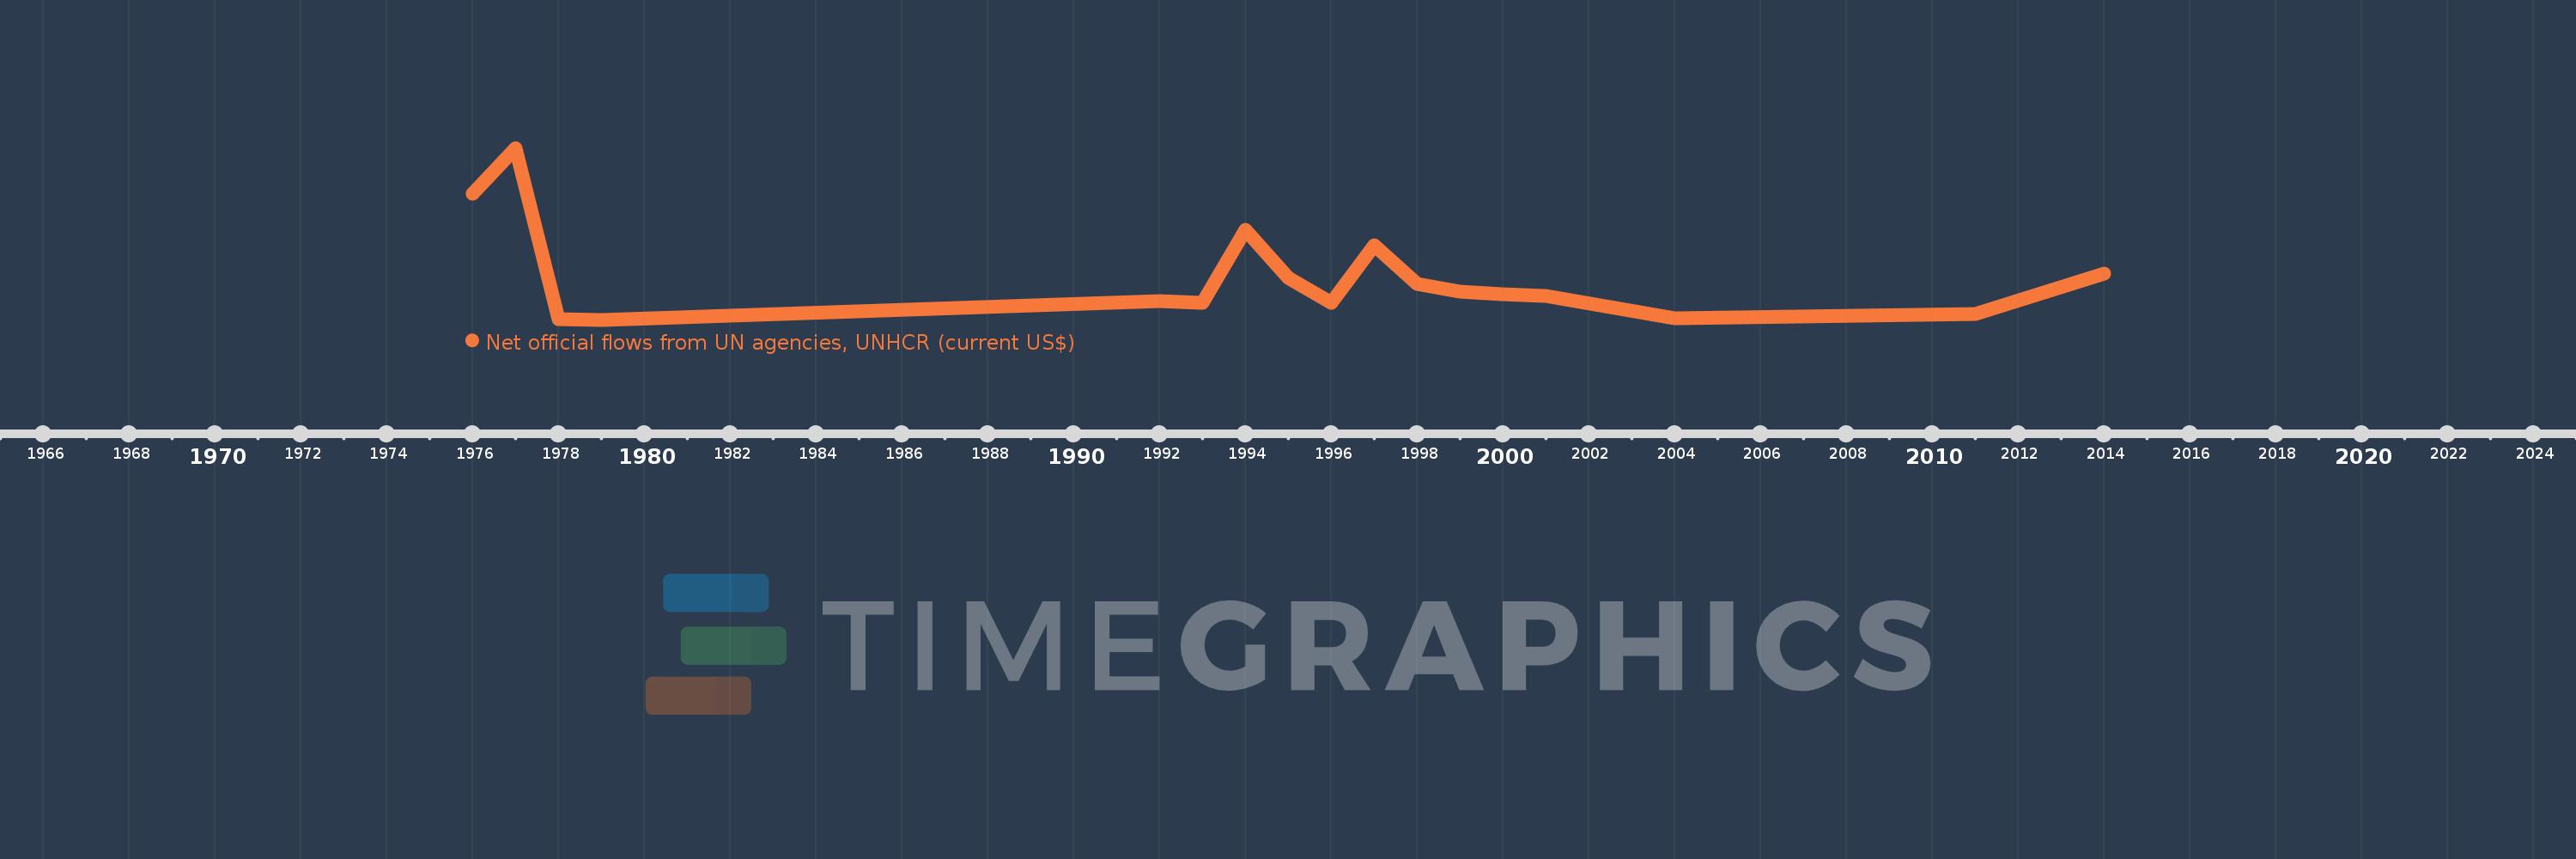
This timeline shows a graph from 1976 to 2014 of Guinea-Bissau. No data until 1975. Number of actual observations by date: 17.
Source name:
World Development Indicators
Source organization:
Development Assistance Committee of the Organisation for Economic Co-operation and Development, Geographical Distribution of Financial Flows to Developing Countries, Development Co-operation Report, and International Development Statistics database. Data are available online at: www.oecd.org/dac/stats/idsonline.
Categories, topics:
Aid Effectiveness
Last updated:
apr 23, 2017
Indicators value changes by year
Meaning:
547.059K
Minimum:
10.0K
jan 1, 1979
Maximum:
2.18 mln
jan 1, 1977
At the date of observation
Value
Absolute change
Change from the previous value
jan 1, 1976
1.6 mln
+1.6 mln
0.0%
jan 1, 1977
2.18 mln
+580.0K
36.25%
jan 1, 1978
20.0K
-2.16 mln
-99.08%
jan 1, 1979
10.0K
-10.0K
-50.0%
jan 1, 1992
250.0K
+240.0K
2.4K%
jan 1, 1993
220.0K
-30.0K
-12.0%
jan 1, 1994
1.15 mln
+930.0K
422.73%
jan 1, 1995
540.0K
-610.0K
-53.04%
jan 1, 1996
220.0K
-320.0K
-59.26%
jan 1, 1997
950.0K
+730.0K
331.82%
jan 1, 1998
460.0K
-490.0K
-51.58%
jan 1, 1999
360.0K
-100.0K
-21.74%
jan 1, 2000
330.0K
-30.0K
-8.33%
jan 1, 2001
310.0K
-20.0K
-6.06%
jan 1, 2004
30.0K
-280.0K
-90.32%
jan 1, 2011
80.0K
+50.0K
166.67%
jan 1, 2014
590.0K
+510.0K
637.5%
Ranking of countries by current statistics by years