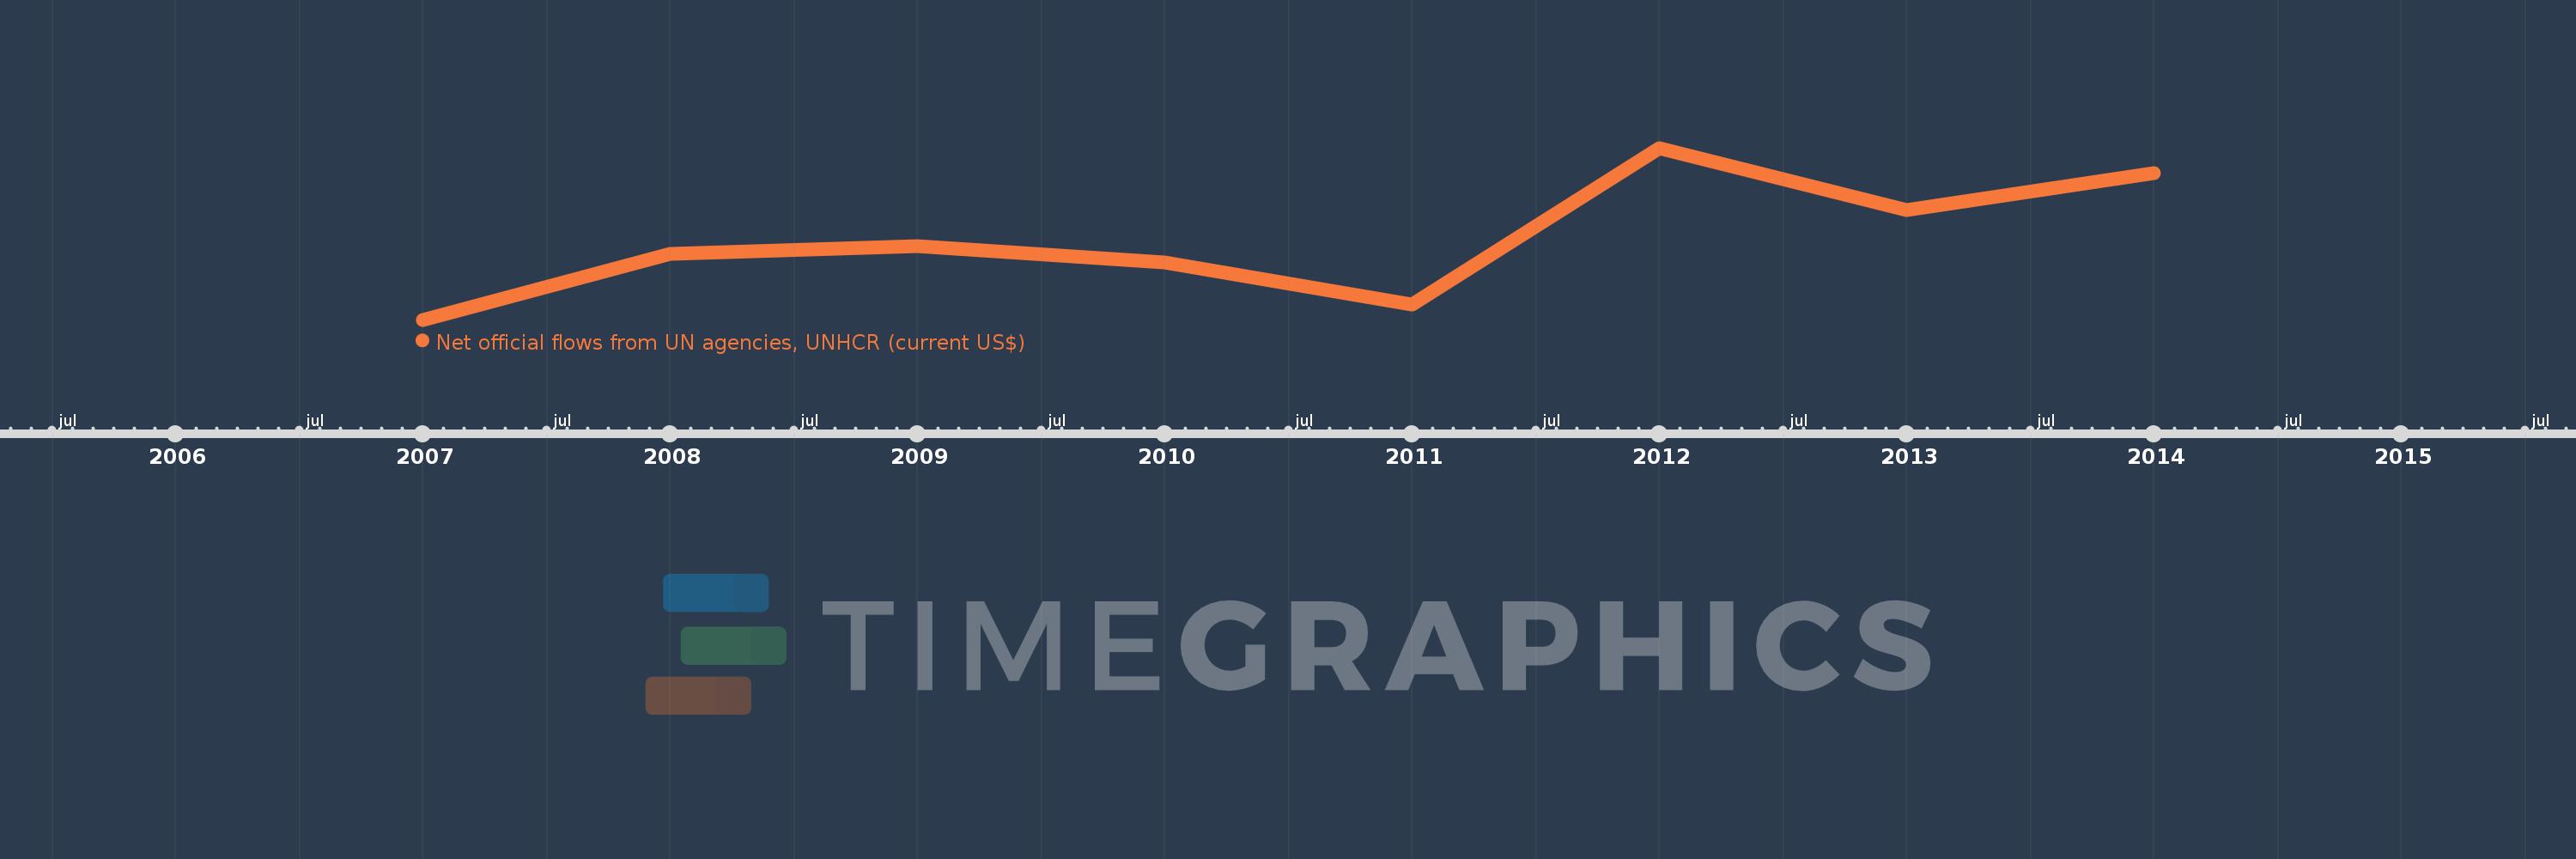
This timeline shows a graph from 2007 to 2014 of Montenegro. No data until 2006. Number of actual observations by date: 8.
Source name:
World Development Indicators
Source organization:
Development Assistance Committee of the Organisation for Economic Co-operation and Development, Geographical Distribution of Financial Flows to Developing Countries, Development Co-operation Report, and International Development Statistics database. Data are available online at: www.oecd.org/dac/stats/idsonline.
Categories, topics:
Aid Effectiveness
Last updated:
apr 23, 2017
Indicators value changes by year
Meaning:
1.456 mln
Minimum:
320.0K
jan 1, 2007
Maximum:
2.76 mln
jan 1, 2012
At the date of observation
Value
Absolute change
Change from the previous value
jan 1, 2007
320.0K
+320.0K
0.0%
jan 1, 2008
1.26 mln
+940.0K
293.75%
jan 1, 2009
1.36 mln
+100.0K
7.94%
jan 1, 2010
1.13 mln
-230.0K
-16.91%
jan 1, 2011
540.0K
-590.0K
-52.21%
jan 1, 2012
2.76 mln
+2.22 mln
411.11%
jan 1, 2013
1.88 mln
-880.0K
-31.88%
jan 1, 2014
2.4 mln
+520.0K
27.66%
Ranking of countries by current statistics by years