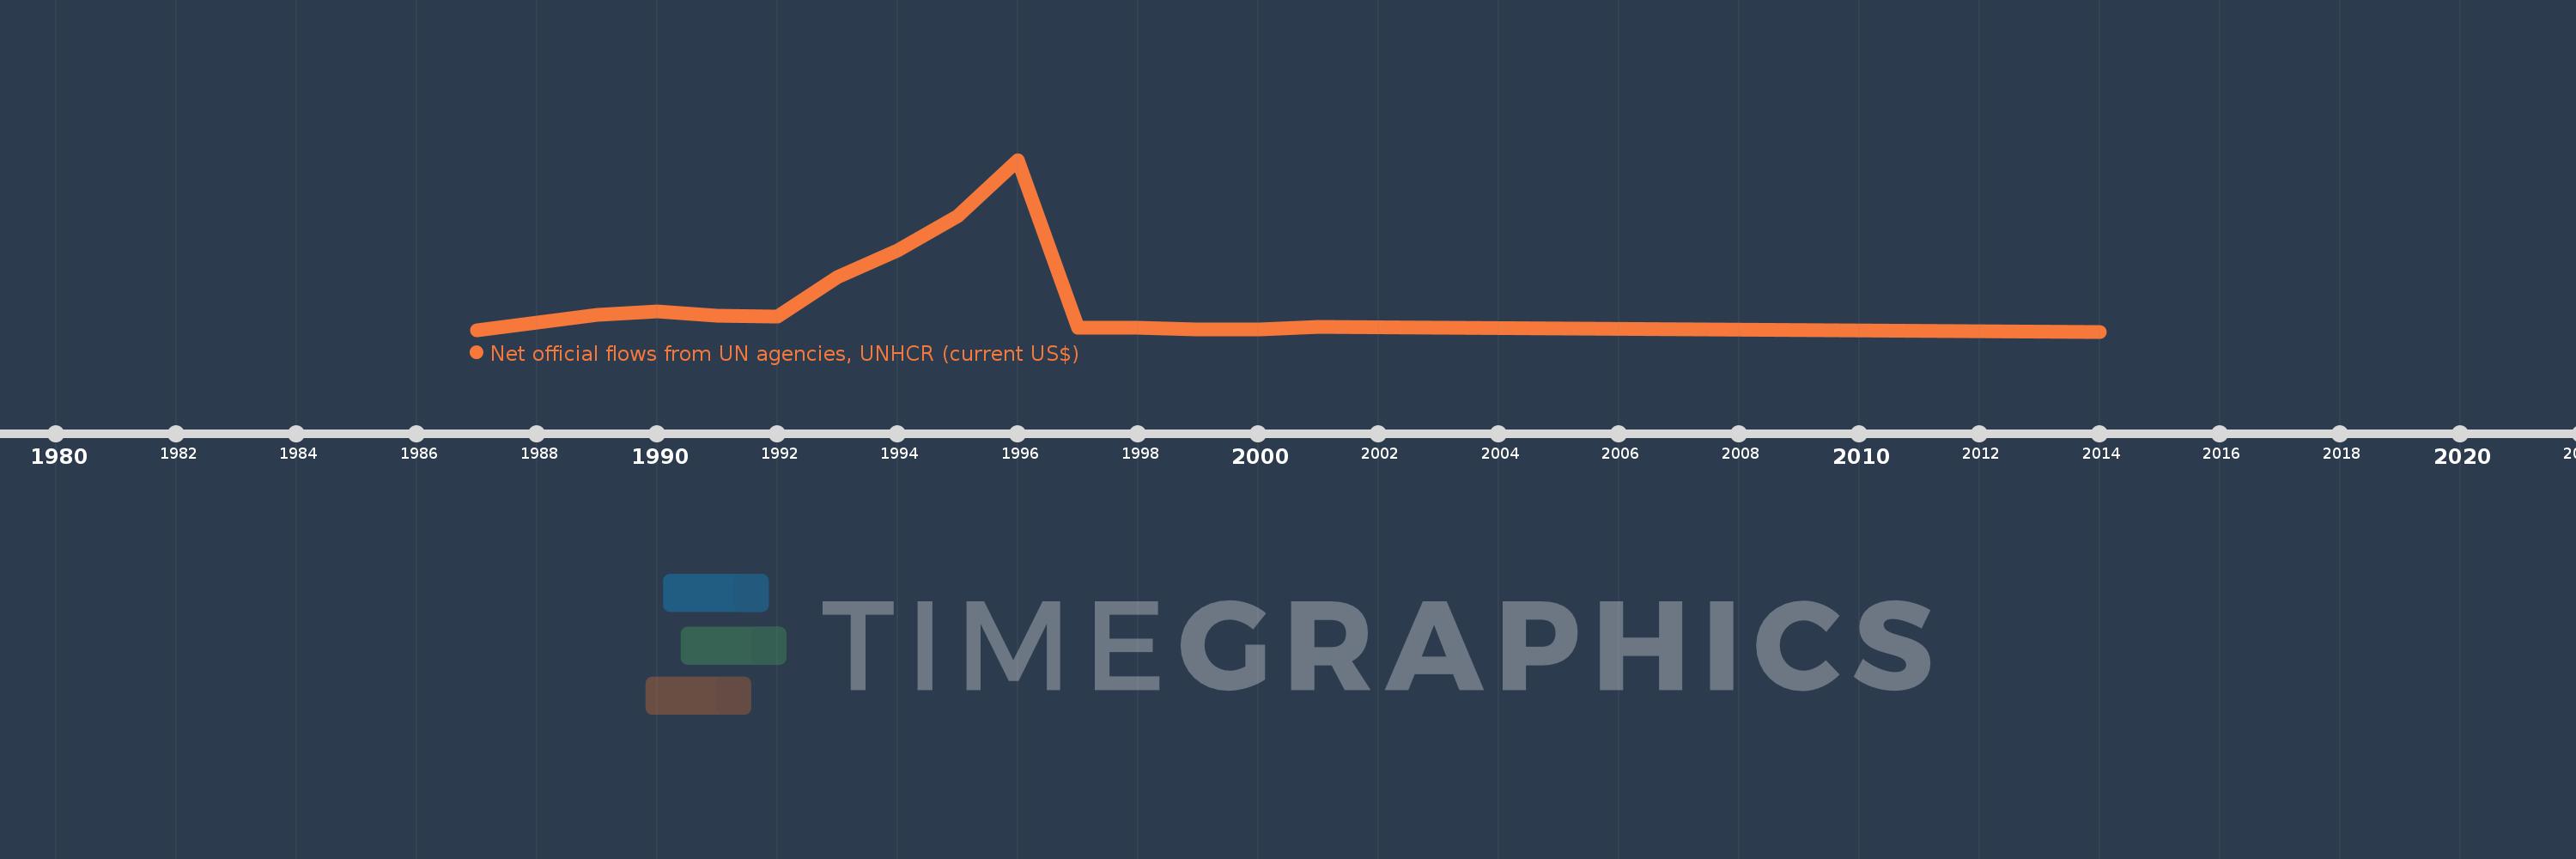
This timeline shows a graph from 1987 to 2014 of Guatemala. No data until 1986. Number of actual observations by date: 15.
Source name:
World Development Indicators
Source organization:
Development Assistance Committee of the Organisation for Economic Co-operation and Development, Geographical Distribution of Financial Flows to Developing Countries, Development Co-operation Report, and International Development Statistics database. Data are available online at: www.oecd.org/dac/stats/idsonline.
Categories, topics:
Aid Effectiveness
Last updated:
apr 23, 2017
Indicators value changes by year
Meaning:
1.96 mln
Minimum:
0.0
jan 1, 2014
Maximum:
9.94 mln
jan 1, 1996
At the date of observation
Value
Absolute change
Change from the previous value
jan 1, 1987
80.0K
+80.0K
0.0%
jan 1, 1989
950.0K
+870.0K
1.09K%
jan 1, 1990
1.18 mln
+230.0K
24.21%
jan 1, 1991
920.0K
-260.0K
-22.03%
jan 1, 1992
860.0K
-60.0K
-6.52%
jan 1, 1993
3.15 mln
+2.29 mln
266.28%
jan 1, 1994
4.69 mln
+1.54 mln
48.89%
jan 1, 1995
6.66 mln
+1.97 mln
42.0%
jan 1, 1996
9.94 mln
+3.28 mln
49.25%
jan 1, 1997
210.0K
-9.73 mln
-97.89%
jan 1, 1998
220.0K
+10.0K
4.76%
jan 1, 1999
140.0K
-80.0K
-36.36%
jan 1, 2000
140.0K
0.0
0.0%
jan 1, 2001
260.0K
+120.0K
85.71%
jan 1, 2014
0.0
-260.0K
-100.0%
Ranking of countries by current statistics by years