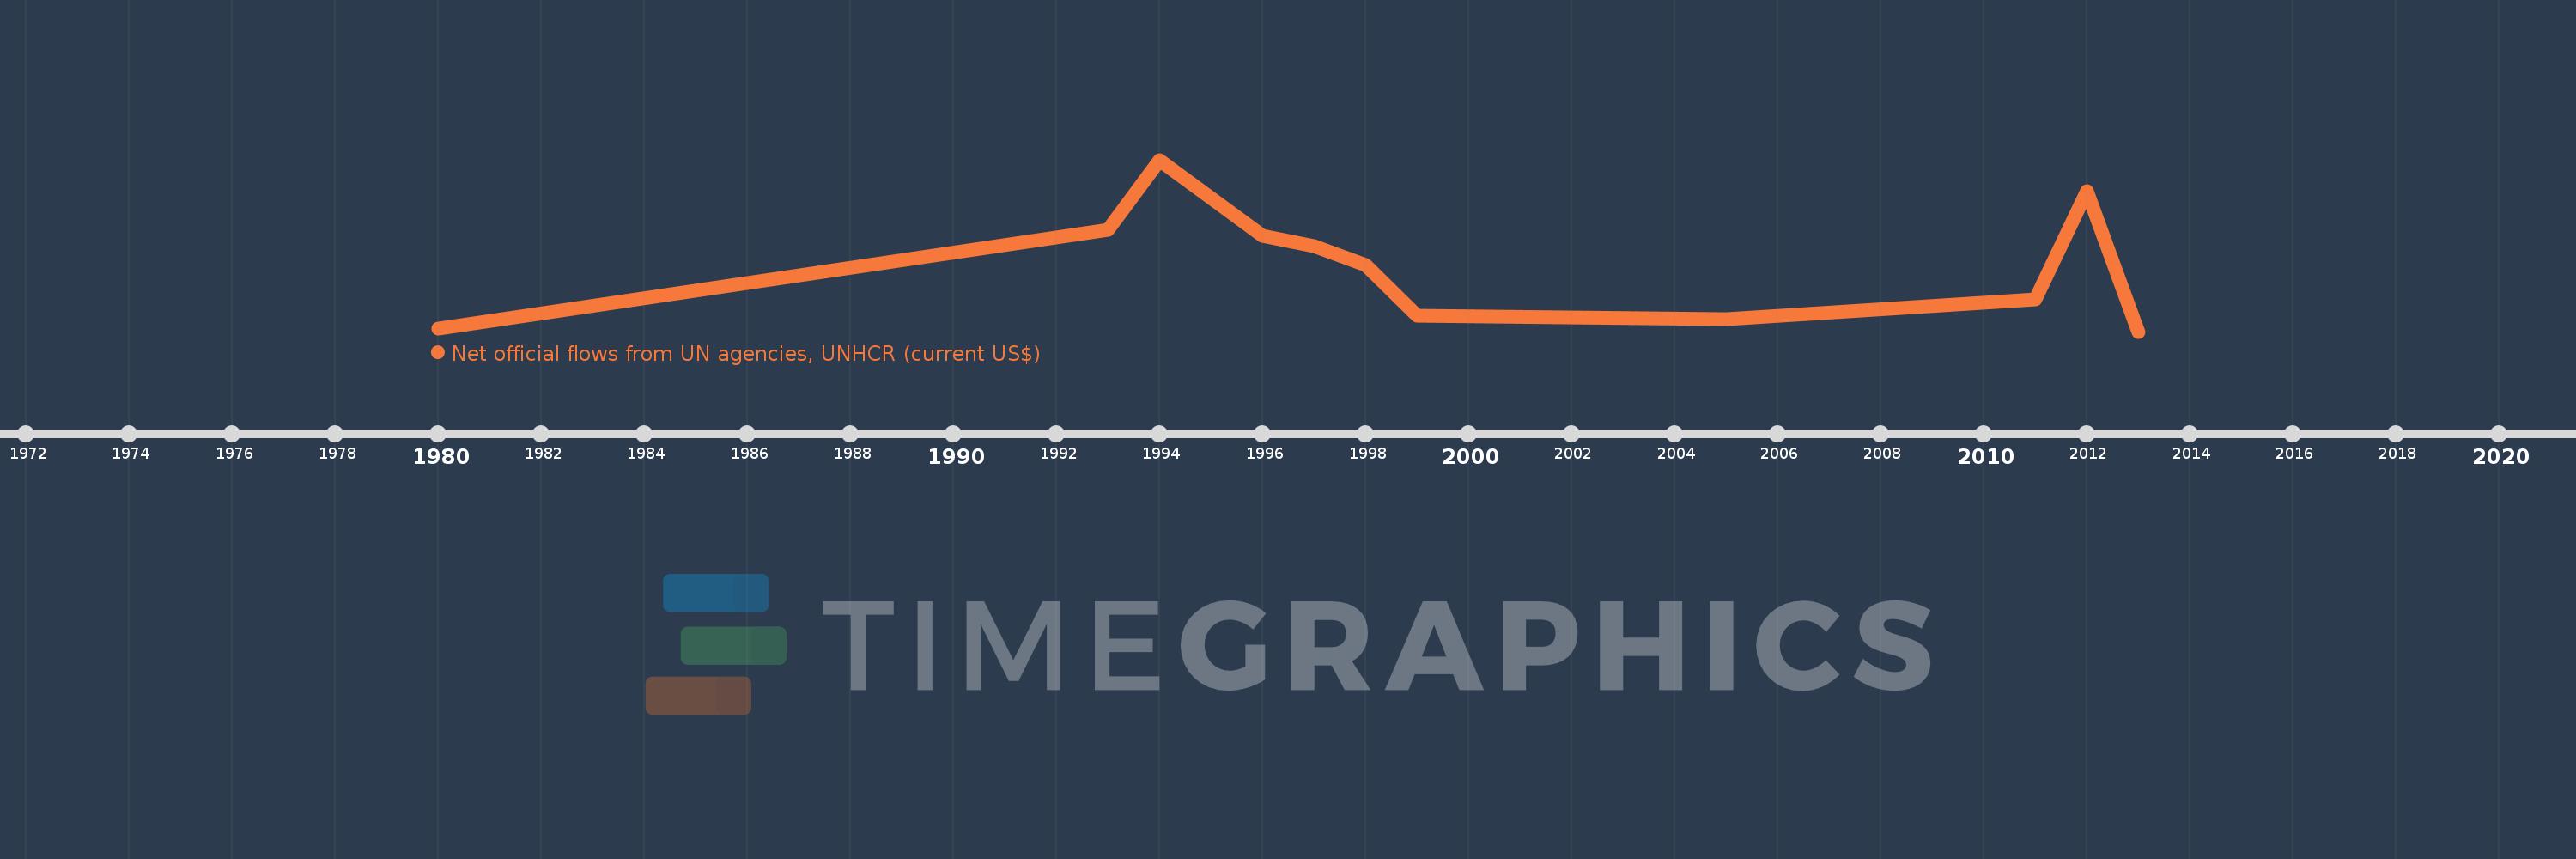
This timeline shows a graph from 1980 to 2013 of Dominican Republic. No data until 1979. Number of actual observations by date: 12.
Source name:
World Development Indicators
Source organization:
Development Assistance Committee of the Organisation for Economic Co-operation and Development, Geographical Distribution of Financial Flows to Developing Countries, Development Co-operation Report, and International Development Statistics database. Data are available online at: www.oecd.org/dac/stats/idsonline.
Categories, topics:
Aid Effectiveness
Last updated:
apr 23, 2017
Indicators value changes by year
Meaning:
508.333K
Minimum:
0.0
jan 1, 2013
Maximum:
1.22 mln
jan 1, 1994
At the date of observation
Value
Absolute change
Change from the previous value
jan 1, 1980
20.0K
+20.0K
0.0%
jan 1, 1993
720.0K
+700.0K
3.5K%
jan 1, 1994
1.22 mln
+500.0K
69.44%
jan 1, 1995
950.0K
-270.0K
-22.13%
jan 1, 1996
680.0K
-270.0K
-28.42%
jan 1, 1997
610.0K
-70.0K
-10.29%
jan 1, 1998
470.0K
-140.0K
-22.95%
jan 1, 1999
110.0K
-360.0K
-76.6%
jan 1, 2005
90.0K
-20.0K
-18.18%
jan 1, 2011
230.0K
+140.0K
155.56%
jan 1, 2012
1000.0K
+770.0K
334.78%
jan 1, 2013
0.0
-1000.0K
-100.0%
Ranking of countries by current statistics by years