29
/
en
AIzaSyAYiBZKx7MnpbEhh9jyipgxe19OcubqV5w
April 1, 2024
103977
Chad
TCD
true
2
1
Net official flows from UN agencies, UNHCR (current US$)
2013,2012,2011,2010,2009,2008,2006,2005,2002,2001,2000,1999,1998,1997,1996,1995,1993,1987,1986,1985,1984,1983,1982
Download
Global statistics library →Chad →

Net official flows from UN agencies, UNHCR (current US$)

This statistics in other country:
AfghanistanAlbaniaAlgeriaAngolaArab WorldArgentinaArmeniaAzerbaijanBahrainBangladeshBelarusBelizeBeninBoliviaBosnia and HerzegovinaBotswanaBrazilBulgariaBurkina FasoBurundiCabo VerdeCambodiaCameroonCaribbean small statesCentral African RepublicCentral Europe and the BalticsChadChileChinaColombiaComorosCongo, Dem. Rep.Congo, Rep.Costa RicaCote d'IvoireCroatiaCubaCyprusCzech RepublicDjiboutiDominican RepublicEast Asia & PacificEast Asia & Pacific (excluding high income)East Asia & Pacific (IDA & IBRD countries)EcuadorEgypt, Arab Rep.El SalvadorEquatorial GuineaEritreaEthiopiaEuro areaEurope & Central AsiaEurope & Central Asia (excluding high income)Europe & Central Asia (IDA & IBRD countries)European UnionFragile and conflict affected situationsGabonGambia, TheGeorgiaGhanaGuatemalaGuineaGuinea-BissauHaitiHeavily indebted poor countries (HIPC)High incomeHondurasHong Kong SAR, ChinaHungaryIBRD onlyIDA & IBRD totalIDA blendIDA onlyIDA totalIndiaIndonesiaIran, Islamic Rep.IraqIsraelJamaicaJordanKazakhstanKenyaKorea, Dem. People’s Rep.Korea, Rep.KosovoKuwaitKyrgyz RepublicLao PDRLatin America & Caribbean Latin America & Caribbean (excluding high income)Latin America & the Caribbean (IDA & IBRD countries)LatviaLeast developed countries: UN classificationLebanonLesothoLiberiaLibyaLow & middle incomeLow incomeLower middle incomeMacao SAR, ChinaMacedonia, FYRMadagascarMalawiMalaysiaMaliMaltaMauritaniaMexicoMiddle East & North AfricaMiddle East & North Africa (excluding high income)Middle East & North Africa (IDA & IBRD countries)Middle incomeMoldovaMongoliaMontenegroMoroccoMozambiqueMyanmarNamibiaNepalNicaraguaNigerNigeriaOECD membersOther small statesPakistanPanamaPapua New GuineaParaguayPeruPhilippinesPolandRomaniaRussian FederationRwandaSao Tome and PrincipeSaudi ArabiaSenegalSerbiaSierra LeoneSingaporeSlovak RepublicSloveniaSmall statesSomaliaSouth AfricaSouth AsiaSouth Asia (IDA & IBRD)South SudanSri LankaSub-Saharan Africa Sub-Saharan Africa (excluding high income)Sub-Saharan Africa (IDA & IBRD countries)SudanSurinameSwazilandSyrian Arab RepublicTajikistanTanzaniaThailandTimor-LesteTogoTunisiaTurkeyTurkmenistanUgandaUkraineUnited Arab EmiratesUpper middle incomeUruguayUzbekistanVenezuela, RBVietnamWorldYemen, Rep.ZambiaZimbabwe
Timeline:
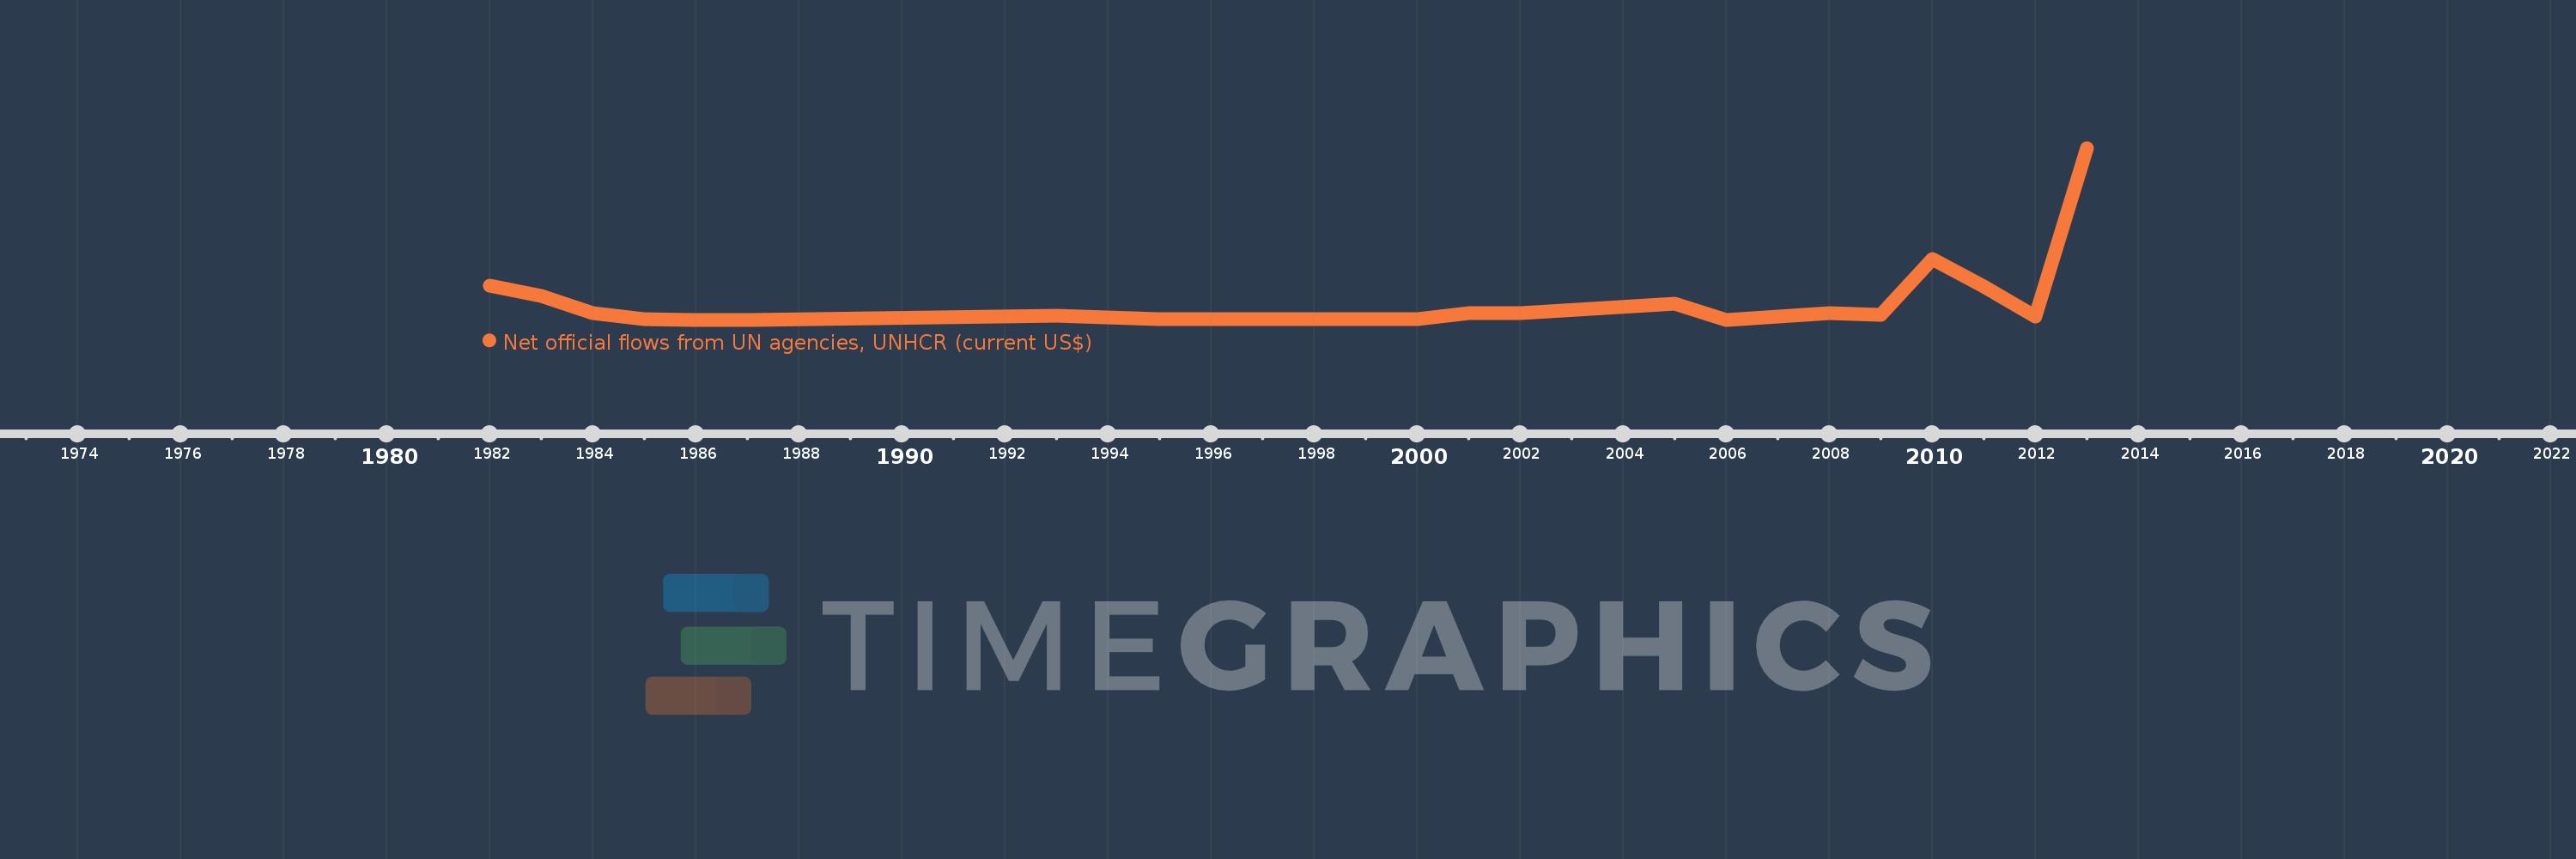
This timeline shows a graph from 1982 to 2013 of Chad. No data until 1981. Number of actual observations by date: 23.
Source name:
World Development Indicators
Source organization:
Development Assistance Committee of the Organisation for Economic Co-operation and Development, Geographical Distribution of Financial Flows to Developing Countries, Development Co-operation Report, and International Development Statistics database. Data are available online at: www.oecd.org/dac/stats/idsonline.
Categories, topics:
Aid Effectiveness
Last updated:
apr 23, 2017
Indicators value changes by year
Mean:
3.477 mln
Minimum:
10.0K
jan 1, 1986
Maximum:
35.93 mln
jan 1, 2013
At the date of observation
Value
Absolute change
Change from previous value
jan 1, 1982
7.14 mln
+7.14 mln
0.0%
jan 1, 1983
4.92 mln
-2.22 mln
-31.09%
jan 1, 1984
1.31 mln
-3.61 mln
-73.37%
jan 1, 1985
60.0K
-1.25 mln
-95.42%
jan 1, 1986
10.0K
-50.0K
-83.33%
jan 1, 1987
20.0K
+10.0K
100.0%
jan 1, 1993
770.0K
+750.0K
3.75K%
jan 1, 1995
110.0K
-660.0K
-85.71%
jan 1, 1996
90.0K
-20.0K
-18.18%
jan 1, 1997
110.0K
+20.0K
22.22%
jan 1, 1998
140.0K
+30.0K
27.27%
jan 1, 1999
130.0K
-10.0K
-7.14%
jan 1, 2000
170.0K
+40.0K
30.77%
jan 1, 2001
1.35 mln
+1.18 mln
694.12%
jan 1, 2002
1.48 mln
+130.0K
9.63%
jan 1, 2005
3.39 mln
+1.91 mln
129.05%
jan 1, 2006
20.0K
-3.37 mln
-99.41%
jan 1, 2008
1.43 mln
+1.41 mln
7.05K%
jan 1, 2009
980.0K
-450.0K
-31.47%
jan 1, 2010
12.73 mln
+11.75 mln
1.2K%
jan 1, 2011
7.01 mln
-5.72 mln
-44.93%
jan 1, 2012
660.0K
-6.35 mln
-90.58%
jan 1, 2013
35.93 mln
+35.27 mln
5.34K%
Ranking of countries by current statistics by years

Comments:

Send
PremiumAbout & FeedbackTermsPrivacy
logo
© 2022 Selected Technologies LLC – Morgan Hill, California