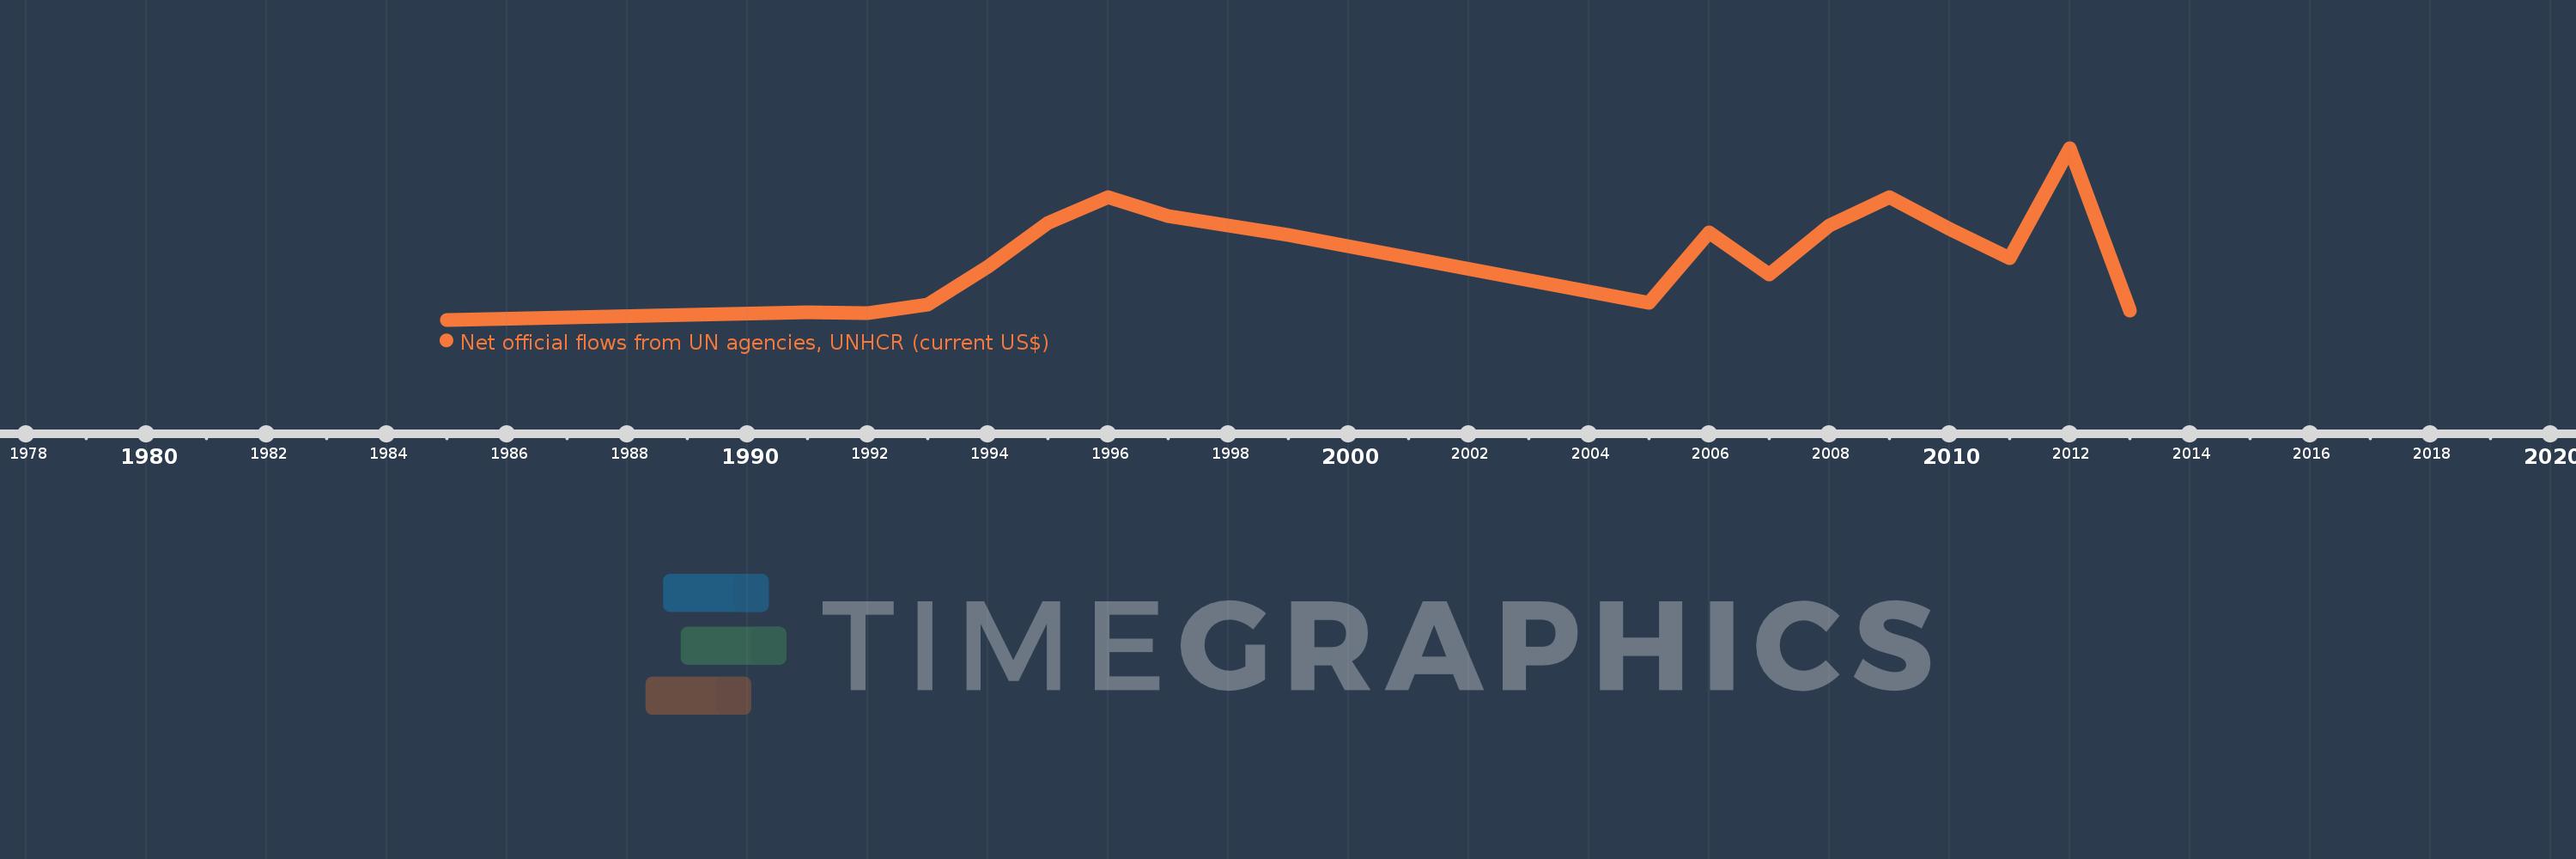
This timeline shows a graph from 1985 to 2013 of Brazil. No data until 1984. Number of actual observations by date: 19.
Source name:
World Development Indicators
Source organization:
Development Assistance Committee of the Organisation for Economic Co-operation and Development, Geographical Distribution of Financial Flows to Developing Countries, Development Co-operation Report, and International Development Statistics database. Data are available online at: www.oecd.org/dac/stats/idsonline.
Categories, topics:
Aid Effectiveness
Last updated:
apr 23, 2017
Indicators value changes by year
Meaning:
1.169 mln
Minimum:
20.0K
jan 1, 1985
Maximum:
2.94 mln
jan 1, 2012
At the date of observation
Value
Absolute change
Change from the previous value
jan 1, 1985
20.0K
+20.0K
0.0%
jan 1, 1991
150.0K
+130.0K
650.0%
jan 1, 1992
130.0K
-20.0K
-13.33%
jan 1, 1993
280.0K
+150.0K
115.38%
jan 1, 1994
920.0K
+640.0K
228.57%
jan 1, 1995
1.67 mln
+750.0K
81.52%
jan 1, 1996
2.1 mln
+430.0K
25.75%
jan 1, 1997
1.78 mln
-320.0K
-15.24%
jan 1, 1998
1.62 mln
-160.0K
-8.99%
jan 1, 1999
1.46 mln
-160.0K
-9.88%
jan 1, 2005
310.0K
-1.15 mln
-78.77%
jan 1, 2006
1.51 mln
+1.2 mln
387.1%
jan 1, 2007
790.0K
-720.0K
-47.68%
jan 1, 2008
1.62 mln
+830.0K
105.06%
jan 1, 2009
2.11 mln
+490.0K
30.25%
jan 1, 2010
1.57 mln
-540.0K
-25.59%
jan 1, 2011
1.06 mln
-510.0K
-32.48%
jan 1, 2012
2.94 mln
+1.88 mln
177.36%
jan 1, 2013
170.0K
-2.77 mln
-94.22%
Ranking of countries by current statistics by years