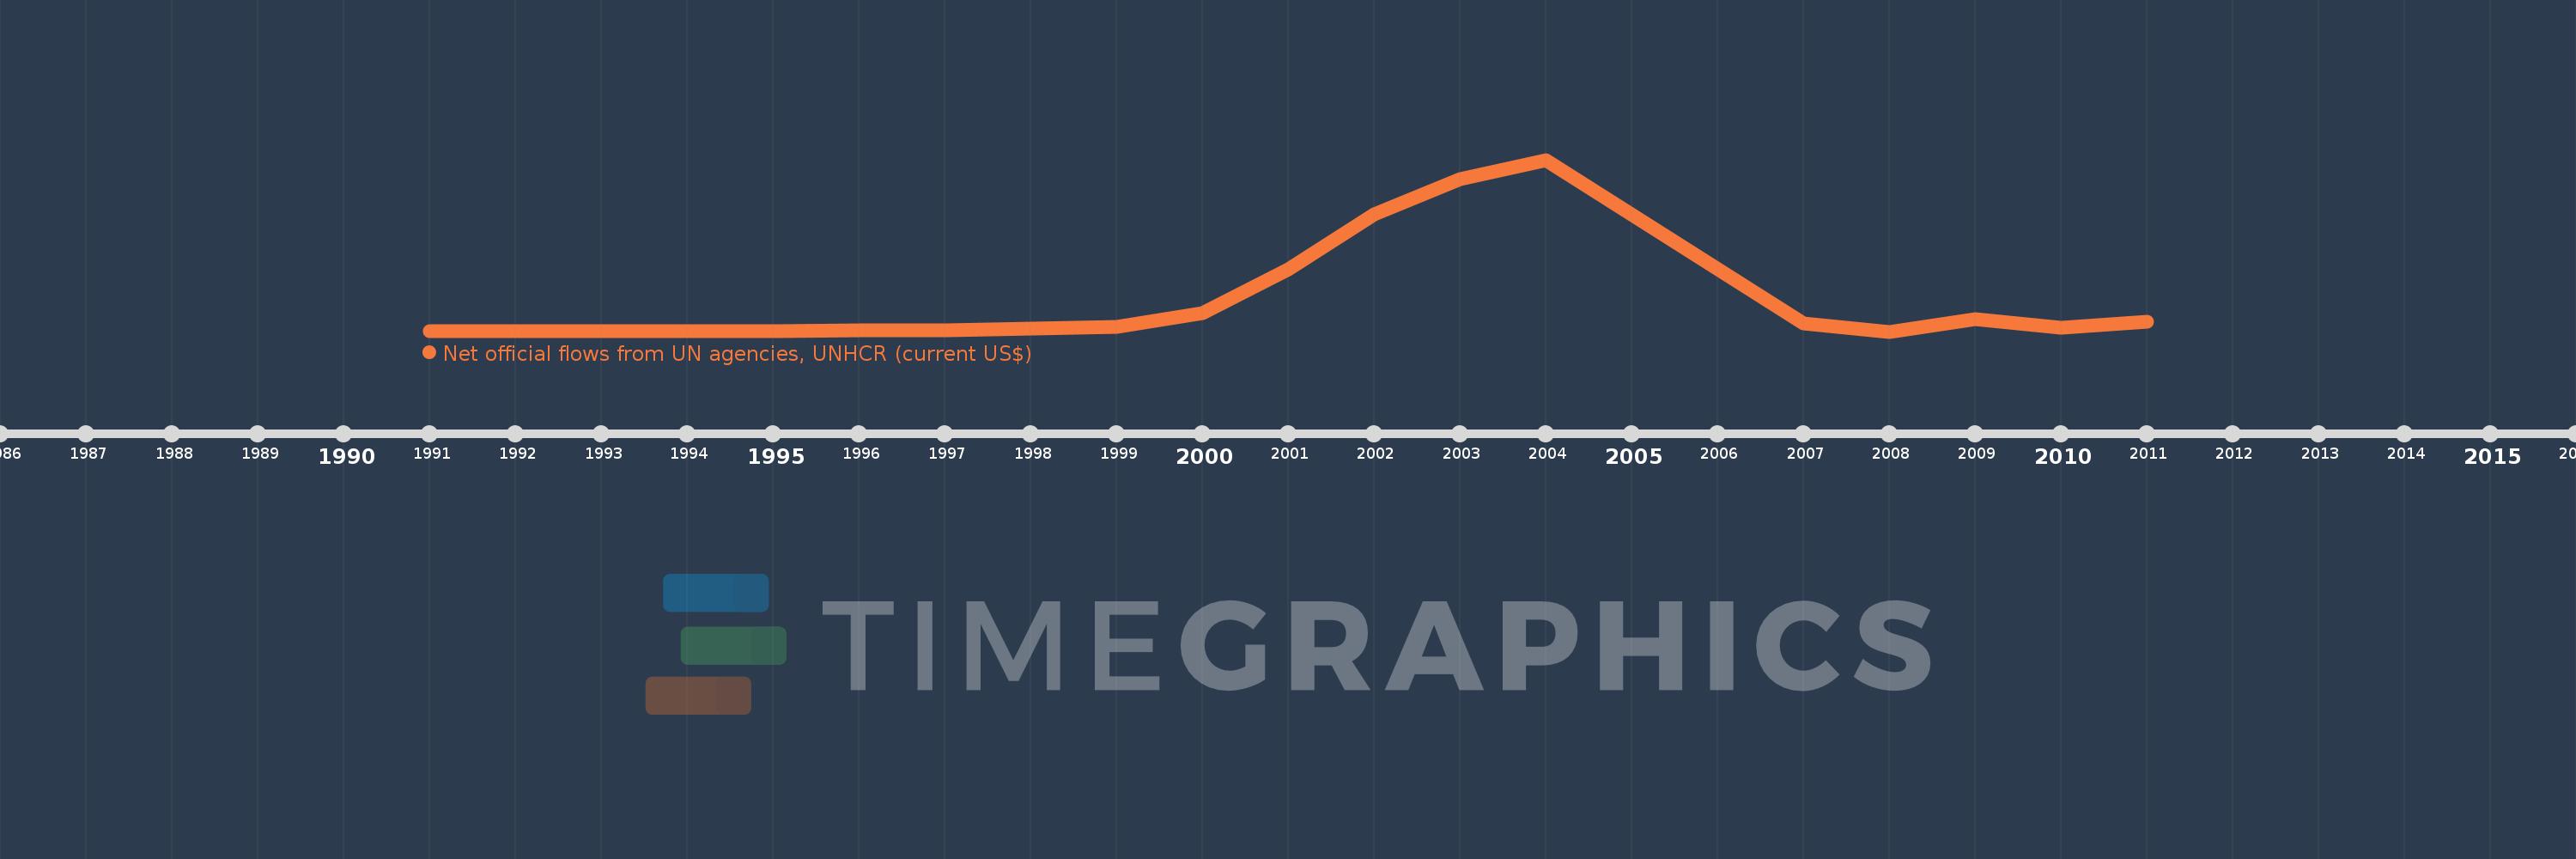
This timeline shows a graph from 1991 to 2011 of Colombia. No data until 1990. Number of actual observations by date: 18.
Source name:
World Development Indicators
Source organization:
Development Assistance Committee of the Organisation for Economic Co-operation and Development, Geographical Distribution of Financial Flows to Developing Countries, Development Co-operation Report, and International Development Statistics database. Data are available online at: www.oecd.org/dac/stats/idsonline.
Categories, topics:
Aid Effectiveness
Last updated:
apr 23, 2017
Indicators value changes by year
Meaning:
904.444K
Minimum:
20.0K
jan 1, 2008
Maximum:
4.85 mln
jan 1, 2004
At the date of observation
Value
Absolute change
Change from the previous value
jan 1, 1991
40.0K
+40.0K
0.0%
jan 1, 1992
40.0K
0.0
0.0%
jan 1, 1993
30.0K
-10.0K
-25.0%
jan 1, 1994
40.0K
+10.0K
33.33%
jan 1, 1995
40.0K
0.0
0.0%
jan 1, 1996
50.0K
+10.0K
25.0%
jan 1, 1997
50.0K
0.0
0.0%
jan 1, 1999
160.0K
+110.0K
220.0%
jan 1, 2000
550.0K
+390.0K
243.75%
jan 1, 2001
1.76 mln
+1.21 mln
220.0%
jan 1, 2002
3.32 mln
+1.56 mln
88.64%
jan 1, 2003
4.31 mln
+990.0K
29.82%
jan 1, 2004
4.85 mln
+540.0K
12.53%
jan 1, 2007
240.0K
-4.61 mln
-95.05%
jan 1, 2008
20.0K
-220.0K
-91.67%
jan 1, 2009
370.0K
+350.0K
1.75K%
jan 1, 2010
120.0K
-250.0K
-67.57%
jan 1, 2011
290.0K
+170.0K
141.67%
Ranking of countries by current statistics by years