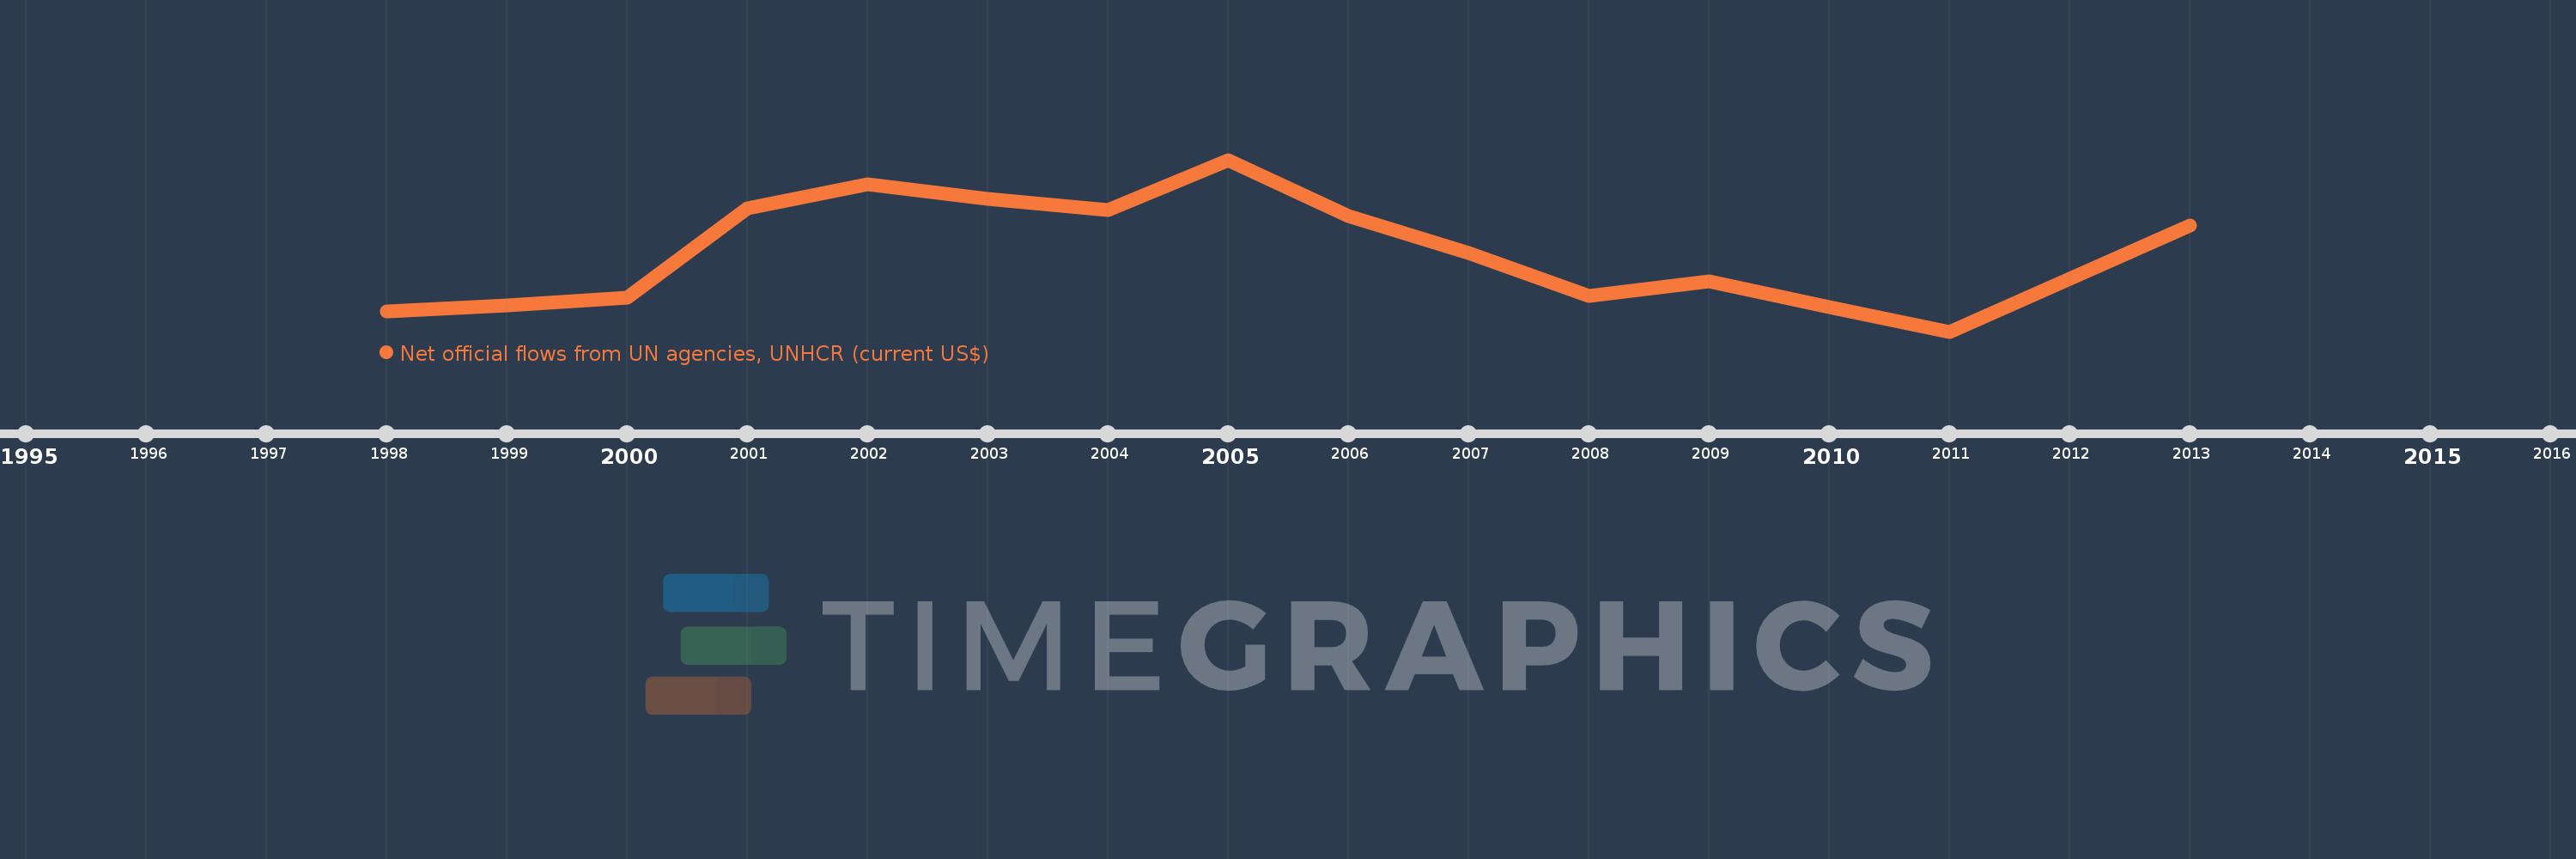
This timeline shows a graph from 1998 to 2013 of Turkmenistan. No data until 1997. Number of actual observations by date: 15.
Source name:
World Development Indicators
Source organization:
Development Assistance Committee of the Organisation for Economic Co-operation and Development, Geographical Distribution of Financial Flows to Developing Countries, Development Co-operation Report, and International Development Statistics database. Data are available online at: www.oecd.org/dac/stats/idsonline.
Categories, topics:
Aid Effectiveness
Last updated:
apr 23, 2017
Indicators value changes by year
Meaning:
464.0K
Minimum:
40.0K
jan 1, 2011
Maximum:
960.0K
jan 1, 2005
At the date of observation
Value
Absolute change
Change from the previous value
jan 1, 1998
150.0K
+150.0K
0.0%
jan 1, 1999
180.0K
+30.0K
20.0%
jan 1, 2000
220.0K
+40.0K
22.22%
jan 1, 2001
700.0K
+480.0K
218.18%
jan 1, 2002
830.0K
+130.0K
18.57%
jan 1, 2003
750.0K
-80.0K
-9.64%
jan 1, 2004
690.0K
-60.0K
-8.0%
jan 1, 2005
960.0K
+270.0K
39.13%
jan 1, 2006
660.0K
-300.0K
-31.25%
jan 1, 2007
460.0K
-200.0K
-30.3%
jan 1, 2008
230.0K
-230.0K
-50.0%
jan 1, 2009
310.0K
+80.0K
34.78%
jan 1, 2010
170.0K
-140.0K
-45.16%
jan 1, 2011
40.0K
-130.0K
-76.47%
jan 1, 2013
610.0K
+570.0K
1.43K%
Ranking of countries by current statistics by years