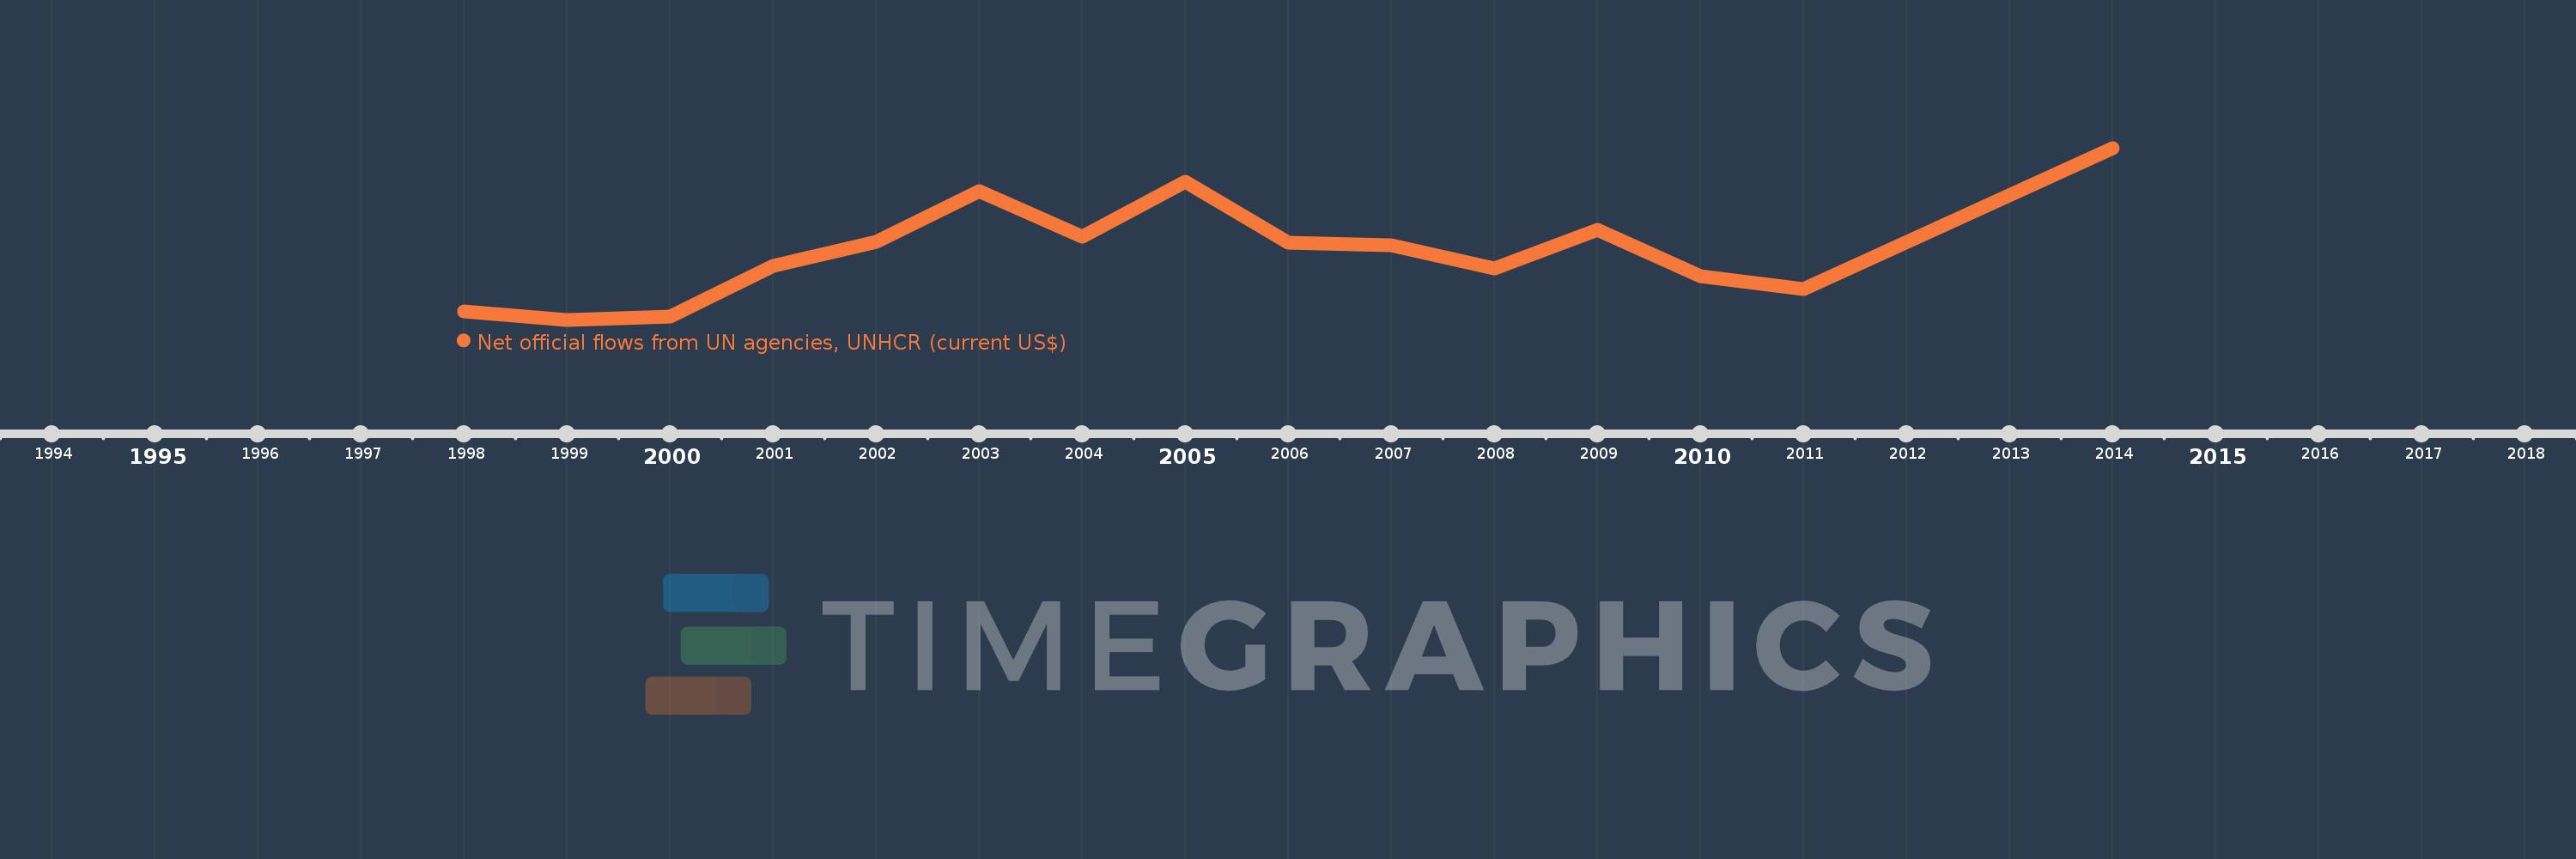
This timeline shows a graph from 1998 to 2014 of Kazakhstan. No data until 1997. Number of actual observations by date: 15.
Source name:
World Development Indicators
Source organization:
Development Assistance Committee of the Organisation for Economic Co-operation and Development, Geographical Distribution of Financial Flows to Developing Countries, Development Co-operation Report, and International Development Statistics database. Data are available online at: www.oecd.org/dac/stats/idsonline.
Categories, topics:
Aid Effectiveness
Last updated:
apr 23, 2017
Indicators value changes by year
Meaning:
788.667K
Minimum:
200.0K
jan 1, 1999
Maximum:
1.67 mln
jan 1, 2014
At the date of observation
Value
Absolute change
Change from the previous value
jan 1, 1998
270.0K
+270.0K
0.0%
jan 1, 1999
200.0K
-70.0K
-25.93%
jan 1, 2000
230.0K
+30.0K
15.0%
jan 1, 2001
660.0K
+430.0K
186.96%
jan 1, 2002
870.0K
+210.0K
31.82%
jan 1, 2003
1.3 mln
+430.0K
49.43%
jan 1, 2004
910.0K
-390.0K
-30.0%
jan 1, 2005
1.38 mln
+470.0K
51.65%
jan 1, 2006
860.0K
-520.0K
-37.68%
jan 1, 2007
840.0K
-20.0K
-2.33%
jan 1, 2008
640.0K
-200.0K
-23.81%
jan 1, 2009
970.0K
+330.0K
51.56%
jan 1, 2010
570.0K
-400.0K
-41.24%
jan 1, 2011
460.0K
-110.0K
-19.3%
jan 1, 2014
1.67 mln
+1.21 mln
263.04%
Ranking of countries by current statistics by years