29
/
en
AIzaSyAYiBZKx7MnpbEhh9jyipgxe19OcubqV5w
April 1, 2024
95139
Burkina Faso
BFA
true
2
1
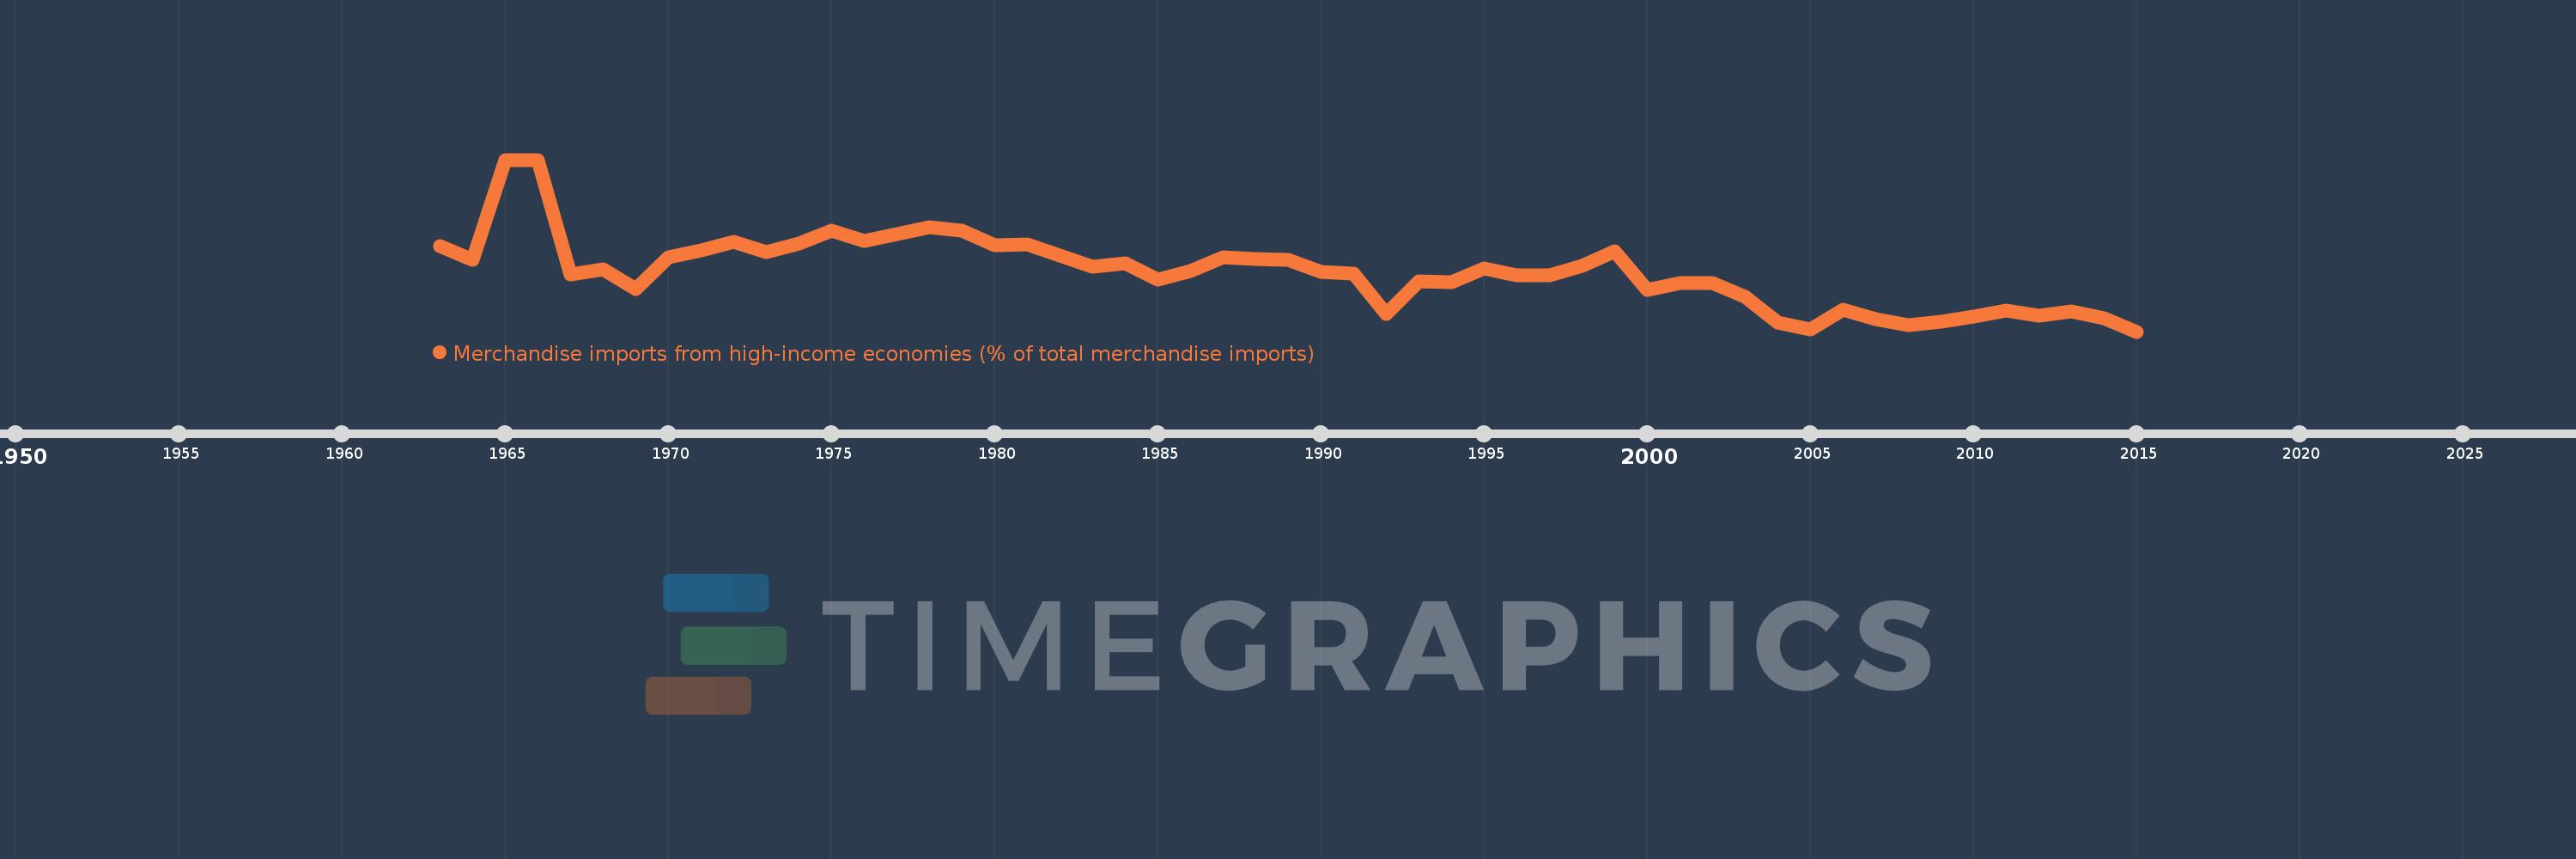
Merchandise imports from high-income economies (% of total merchandise imports)
2015,2014,2013,2012,2011,2010,2009,2008,2007,2006,2005,2004,2003,2002,2001,2000,1999,1998,1997,1996,1995,1994,1993,1992,1991,1990,1989,1988,1987,1986,1985,1984,1983,1982,1981,1980,1979,1978,1977,1976,1975,1974,1973,1972,1971,1970,1969,1968,1967,1966,1965,1964,1963
This statistics in other country:
AfghanistanAlbaniaAlgeriaAngolaAntigua and BarbudaArab WorldArgentinaArmeniaArubaAustraliaAustriaAzerbaijanBahamas, TheBahrainBangladeshBarbadosBelarusBelgiumBelizeBeninBermudaBoliviaBosnia and HerzegovinaBrazilBrunei DarussalamBulgariaBurkina FasoBurundiCabo VerdeCambodiaCameroonCanadaCaribbean small statesCentral African RepublicCentral Europe and the BalticsChadChileChinaColombiaComorosCongo, Dem. Rep.Congo, Rep.Costa RicaCote d'IvoireCroatiaCubaCyprusCzech RepublicDenmarkDjiboutiDominicaDominican RepublicEarly-demographic dividendEast Asia & PacificEast Asia & Pacific (excluding high income)East Asia & Pacific (IDA & IBRD countries)EcuadorEgypt, Arab Rep.El SalvadorEquatorial GuineaEstoniaEthiopiaEuro areaEurope & Central AsiaEurope & Central Asia (excluding high income)Europe & Central Asia (IDA & IBRD countries)European UnionFaroe IslandsFijiFinlandFragile and conflict affected situationsFranceFrench PolynesiaGabonGambia, TheGeorgiaGermanyGhanaGibraltarGreeceGreenlandGrenadaGuamGuatemalaGuineaGuinea-BissauGuyanaHaitiHeavily indebted poor countries (HIPC)High incomeHondurasHong Kong SAR, ChinaHungaryIBRD onlyIcelandIDA & IBRD totalIDA blendIDA onlyIDA totalIndiaIndonesiaIran, Islamic Rep.IraqIrelandIsraelItalyJamaicaJapanJordanKazakhstanKenyaKiribatiKorea, Dem. People’s Rep.Korea, Rep.KosovoKuwaitKyrgyz RepublicLao PDRLate-demographic dividendLatin America & Caribbean Latin America & Caribbean (excluding high income)Latin America & the Caribbean (IDA & IBRD countries)LatviaLeast developed countries: UN classificationLebanonLiberiaLibyaLithuaniaLow & middle incomeLow incomeLower middle incomeLuxembourgMacao SAR, ChinaMacedonia, FYRMadagascarMalawiMalaysiaMaldivesMaliMaltaMauritaniaMauritiusMexicoMiddle East & North AfricaMiddle East & North Africa (excluding high income)Middle East & North Africa (IDA & IBRD countries)Middle incomeMoldovaMongoliaMontenegroMoroccoMozambiqueMyanmarNauruNepalNetherlandsNew CaledoniaNew ZealandNicaraguaNigerNigeriaNorth AmericaNorwayOECD membersOmanOther small statesPacific island small statesPakistanPanamaPapua New GuineaParaguayPeruPhilippinesPolandPortugalPost-demographic dividendPre-demographic dividendQatarRomaniaRussian FederationRwandaSamoaSao Tome and PrincipeSaudi ArabiaSenegalSerbiaSeychellesSierra LeoneSingaporeSlovak RepublicSloveniaSmall statesSolomon IslandsSomaliaSouth AfricaSouth AsiaSouth Asia (IDA & IBRD)SpainSri LankaSt. Kitts and NevisSt. LuciaSt. Vincent and the GrenadinesSub-Saharan Africa Sub-Saharan Africa (excluding high income)Sub-Saharan Africa (IDA & IBRD countries)SudanSurinameSwedenSwitzerlandSyrian Arab RepublicTajikistanTanzaniaThailandTogoTongaTrinidad and TobagoTunisiaTurkeyTurkmenistanTuvaluUgandaUkraineUnited Arab EmiratesUnited KingdomUnited StatesUpper middle incomeUruguayUzbekistanVanuatuVenezuela, RBVietnamWorldYemen, Rep.ZambiaZimbabwe Timeline:
This timeline shows a graph from 1963 to 2015 of Burkina Faso. No data until 1962. Number of actual observations by date: 53.
Source name:
World Development Indicators
Source organization:
World Bank staff estimates based data from International Monetary Fund's Direction of Trade database.
Categories, topics:
Private Sector, Trade
Last updated:
apr 23, 2017
Indicators value changes by year
Minimum:
35.684
jan 1, 2015
At the date of observation
Value
Absolute change
Change from previous value
jan 1, 1963
67.723
+67.723
0.0%
jan 1, 1964
62.568
-5.155
-7.61%
jan 1, 1965
100.0
+37.432
59.83%
jan 1, 1966
100.0
0.0
0.0%
jan 1, 1967
56.952
-43.048
-43.05%
jan 1, 1968
59.104
+2.152
3.78%
jan 1, 1969
51.724
-7.38
-12.49%
jan 1, 1970
63.564
+11.84
22.89%
jan 1, 1971
66.173
+2.609
4.1%
jan 1, 1972
69.159
+2.986
4.51%
jan 1, 1973
65.452
-3.707
-5.36%
jan 1, 1974
68.673
+3.222
4.92%
jan 1, 1975
73.621
+4.948
7.2%
jan 1, 1976
69.7
-3.921
-5.33%
jan 1, 1977
72.234
+2.534
3.64%
jan 1, 1978
74.62
+2.386
3.3%
jan 1, 1979
73.516
-1.104
-1.48%
jan 1, 1980
67.89
-5.626
-7.65%
jan 1, 1981
68.201
+0.311
0.46%
jan 1, 1982
64.152
-4.049
-5.94%
jan 1, 1983
60.036
-4.116
-6.42%
jan 1, 1984
61.15
+1.114
1.86%
jan 1, 1985
55.211
-5.939
-9.71%
jan 1, 1986
58.367
+3.156
5.72%
jan 1, 1987
63.535
+5.169
8.86%
jan 1, 1988
62.828
-0.707
-1.11%
jan 1, 1989
62.614
-0.214
-0.34%
jan 1, 1990
58.026
-4.588
-7.33%
jan 1, 1991
57.322
-0.703
-1.21%
jan 1, 1992
42.363
-14.959
-26.1%
jan 1, 1993
54.434
+12.071
28.49%
jan 1, 1994
54.135
-0.299
-0.55%
jan 1, 1995
59.333
+5.198
9.6%
jan 1, 1996
56.657
-2.676
-4.51%
jan 1, 1997
56.613
-0.044
-0.08%
jan 1, 1998
60.319
+3.707
6.55%
jan 1, 1999
65.804
+5.485
9.09%
jan 1, 2000
51.185
-14.619
-22.22%
jan 1, 2001
53.916
+2.73
5.33%
jan 1, 2002
53.753
-0.162
-0.3%
jan 1, 2003
48.742
-5.012
-9.32%
jan 1, 2004
39.112
-9.629
-19.76%
jan 1, 2005
36.518
-2.594
-6.63%
jan 1, 2006
43.861
+7.343
20.11%
jan 1, 2007
40.504
-3.358
-7.66%
jan 1, 2008
38.089
-2.414
-5.96%
jan 1, 2009
39.307
+1.218
3.2%
jan 1, 2010
41.151
+1.844
4.69%
jan 1, 2011
43.567
+2.416
5.87%
jan 1, 2012
41.655
-1.912
-4.39%
jan 1, 2013
43.288
+1.633
3.92%
jan 1, 2014
40.575
-2.712
-6.27%
jan 1, 2015
35.684
-4.891
-12.05%
Ranking of countries by current statistics by years


Comments: