29
/
en
AIzaSyAYiBZKx7MnpbEhh9jyipgxe19OcubqV5w
April 1, 2024
287489
Zimbabwe
ZWE
true
2
1
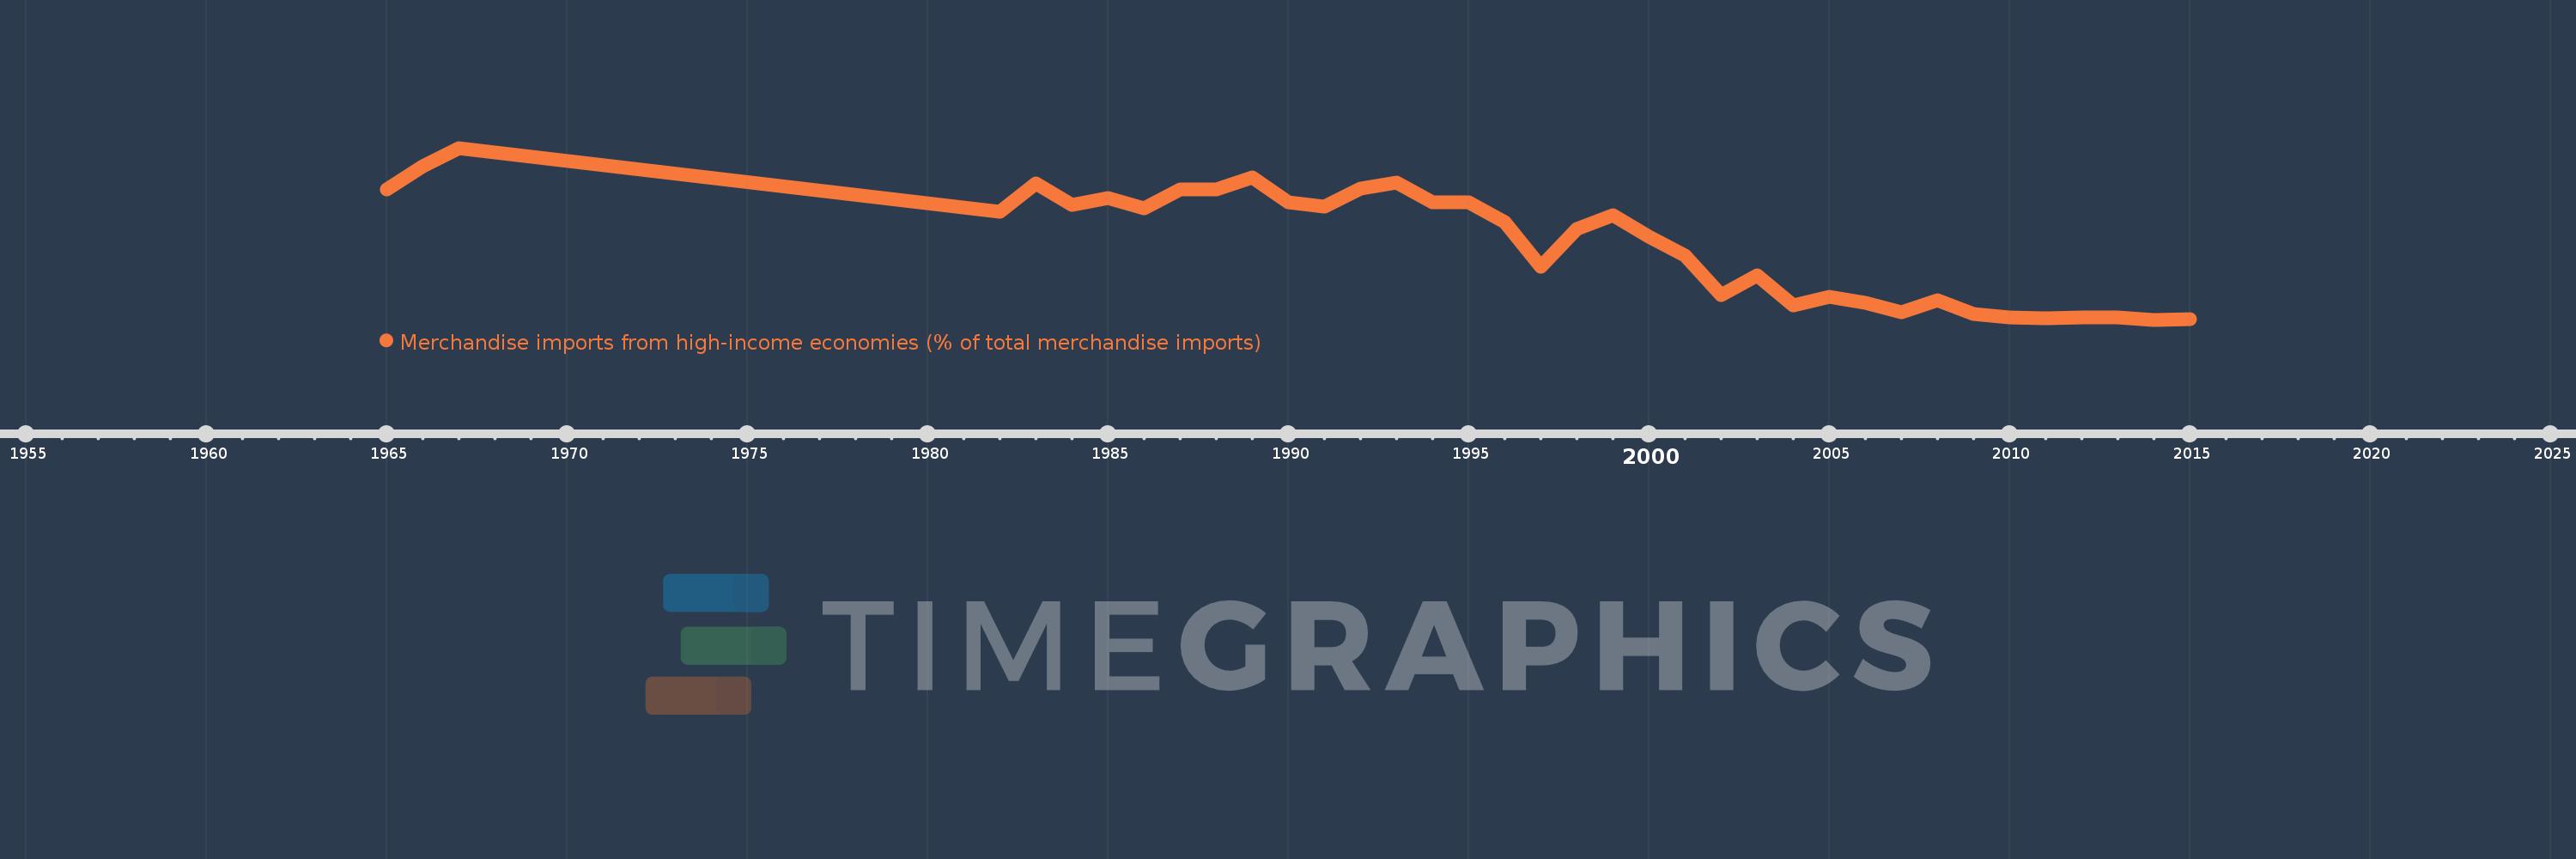
Merchandise imports from high-income economies (% of total merchandise imports)
2015,2014,2013,2012,2011,2010,2009,2008,2007,2006,2005,2004,2003,2002,2001,2000,1999,1998,1997,1996,1995,1994,1993,1992,1991,1990,1989,1988,1987,1986,1985,1984,1983,1982,1967,1966,1965
This statistics in other country:
AfghanistanAlbaniaAlgeriaAngolaAntigua and BarbudaArab WorldArgentinaArmeniaArubaAustraliaAustriaAzerbaijanBahamas, TheBahrainBangladeshBarbadosBelarusBelgiumBelizeBeninBermudaBoliviaBosnia and HerzegovinaBrazilBrunei DarussalamBulgariaBurkina FasoBurundiCabo VerdeCambodiaCameroonCanadaCaribbean small statesCentral African RepublicCentral Europe and the BalticsChadChileChinaColombiaComorosCongo, Dem. Rep.Congo, Rep.Costa RicaCote d'IvoireCroatiaCubaCyprusCzech RepublicDenmarkDjiboutiDominicaDominican RepublicEarly-demographic dividendEast Asia & PacificEast Asia & Pacific (excluding high income)East Asia & Pacific (IDA & IBRD countries)EcuadorEgypt, Arab Rep.El SalvadorEquatorial GuineaEstoniaEthiopiaEuro areaEurope & Central AsiaEurope & Central Asia (excluding high income)Europe & Central Asia (IDA & IBRD countries)European UnionFaroe IslandsFijiFinlandFragile and conflict affected situationsFranceFrench PolynesiaGabonGambia, TheGeorgiaGermanyGhanaGibraltarGreeceGreenlandGrenadaGuamGuatemalaGuineaGuinea-BissauGuyanaHaitiHeavily indebted poor countries (HIPC)High incomeHondurasHong Kong SAR, ChinaHungaryIBRD onlyIcelandIDA & IBRD totalIDA blendIDA onlyIDA totalIndiaIndonesiaIran, Islamic Rep.IraqIrelandIsraelItalyJamaicaJapanJordanKazakhstanKenyaKiribatiKorea, Dem. People’s Rep.Korea, Rep.KosovoKuwaitKyrgyz RepublicLao PDRLate-demographic dividendLatin America & Caribbean Latin America & Caribbean (excluding high income)Latin America & the Caribbean (IDA & IBRD countries)LatviaLeast developed countries: UN classificationLebanonLiberiaLibyaLithuaniaLow & middle incomeLow incomeLower middle incomeLuxembourgMacao SAR, ChinaMacedonia, FYRMadagascarMalawiMalaysiaMaldivesMaliMaltaMauritaniaMauritiusMexicoMiddle East & North AfricaMiddle East & North Africa (excluding high income)Middle East & North Africa (IDA & IBRD countries)Middle incomeMoldovaMongoliaMontenegroMoroccoMozambiqueMyanmarNauruNepalNetherlandsNew CaledoniaNew ZealandNicaraguaNigerNigeriaNorth AmericaNorwayOECD membersOmanOther small statesPacific island small statesPakistanPanamaPapua New GuineaParaguayPeruPhilippinesPolandPortugalPost-demographic dividendPre-demographic dividendQatarRomaniaRussian FederationRwandaSamoaSao Tome and PrincipeSaudi ArabiaSenegalSerbiaSeychellesSierra LeoneSingaporeSlovak RepublicSloveniaSmall statesSolomon IslandsSomaliaSouth AfricaSouth AsiaSouth Asia (IDA & IBRD)SpainSri LankaSt. Kitts and NevisSt. LuciaSt. Vincent and the GrenadinesSub-Saharan Africa Sub-Saharan Africa (excluding high income)Sub-Saharan Africa (IDA & IBRD countries)SudanSurinameSwedenSwitzerlandSyrian Arab RepublicTajikistanTanzaniaThailandTogoTongaTrinidad and TobagoTunisiaTurkeyTurkmenistanTuvaluUgandaUkraineUnited Arab EmiratesUnited KingdomUnited StatesUpper middle incomeUruguayUzbekistanVanuatuVenezuela, RBVietnamWorldYemen, Rep.ZambiaZimbabwe Timeline:
This timeline shows a graph from 1965 to 2015 of Zimbabwe. No data until 1964. Number of actual observations by date: 37.
Source name:
World Development Indicators
Source organization:
World Bank staff estimates based data from International Monetary Fund's Direction of Trade database.
Categories, topics:
Private Sector, Trade
Last updated:
apr 23, 2017
Indicators value changes by year
Maximum:
68.218
jan 1, 1967
At the date of observation
Value
Absolute change
Change from previous value
jan 1, 1965
54.997
+54.997
0.0%
jan 1, 1966
62.234
+7.237
13.16%
jan 1, 1967
68.218
+5.984
9.62%
jan 1, 1982
47.698
-20.52
-30.08%
jan 1, 1983
56.773
+9.075
19.03%
jan 1, 1984
49.872
-6.901
-12.16%
jan 1, 1985
52.316
+2.444
4.9%
jan 1, 1986
48.841
-3.475
-6.64%
jan 1, 1987
54.852
+6.011
12.31%
jan 1, 1988
54.93
+0.078
0.14%
jan 1, 1989
58.861
+3.931
7.16%
jan 1, 1990
50.955
-7.906
-13.43%
jan 1, 1991
49.554
-1.401
-2.75%
jan 1, 1992
55.107
+5.553
11.21%
jan 1, 1993
57.018
+1.911
3.47%
jan 1, 1994
50.718
-6.3
-11.05%
jan 1, 1995
50.746
+0.028
0.05%
jan 1, 1996
44.51
-6.236
-12.29%
jan 1, 1997
30.336
-14.175
-31.85%
jan 1, 1998
42.238
+11.902
39.24%
jan 1, 1999
46.675
+4.438
10.51%
jan 1, 2000
39.908
-6.767
-14.5%
jan 1, 2001
33.67
-6.238
-15.63%
jan 1, 2002
21.163
-12.506
-37.14%
jan 1, 2003
27.573
+6.409
30.29%
jan 1, 2004
17.73
-9.843
-35.7%
jan 1, 2005
20.679
+2.949
16.63%
jan 1, 2006
18.642
-2.037
-9.85%
jan 1, 2007
15.791
-2.851
-15.29%
jan 1, 2008
19.475
+3.684
23.33%
jan 1, 2009
15.068
-4.407
-22.63%
jan 1, 2010
13.902
-1.166
-7.74%
jan 1, 2011
13.735
-0.167
-1.2%
jan 1, 2012
14.049
+0.314
2.28%
jan 1, 2013
14.132
+0.083
0.59%
jan 1, 2014
13.27
-0.861
-6.09%
jan 1, 2015
13.578
+0.307
2.32%
Ranking of countries by current statistics by years


Comments: