29
/
en
AIzaSyAYiBZKx7MnpbEhh9jyipgxe19OcubqV5w
April 1, 2024
254362
Suriname
SUR
true
2
1
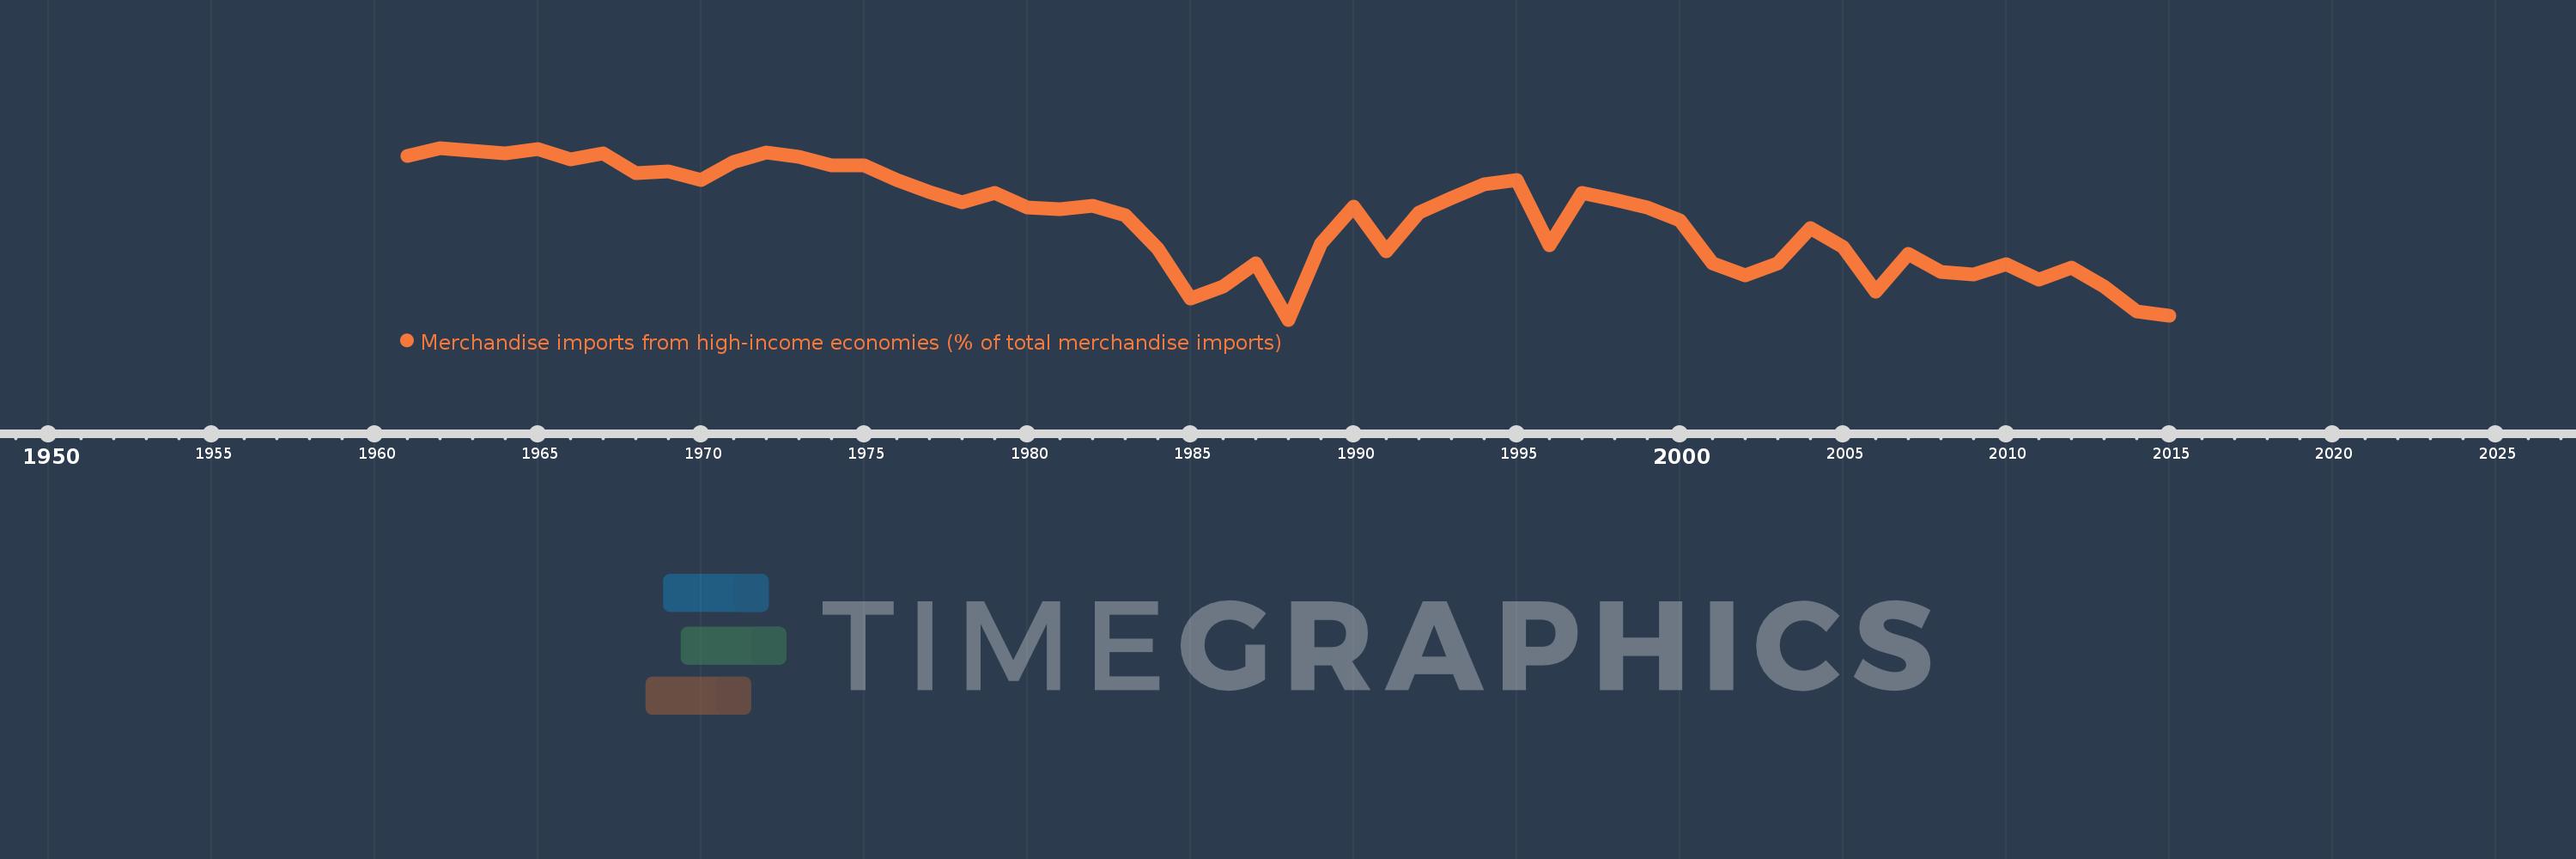
Merchandise imports from high-income economies (% of total merchandise imports)
2015,2014,2013,2012,2011,2010,2009,2008,2007,2006,2005,2004,2003,2002,2001,2000,1999,1998,1997,1996,1995,1994,1993,1992,1991,1990,1989,1988,1987,1986,1985,1984,1983,1982,1981,1980,1979,1978,1977,1976,1975,1974,1973,1972,1971,1970,1969,1968,1967,1966,1965,1964,1962,1961
This statistics in other country:
AfghanistanAlbaniaAlgeriaAngolaAntigua and BarbudaArab WorldArgentinaArmeniaArubaAustraliaAustriaAzerbaijanBahamas, TheBahrainBangladeshBarbadosBelarusBelgiumBelizeBeninBermudaBoliviaBosnia and HerzegovinaBrazilBrunei DarussalamBulgariaBurkina FasoBurundiCabo VerdeCambodiaCameroonCanadaCaribbean small statesCentral African RepublicCentral Europe and the BalticsChadChileChinaColombiaComorosCongo, Dem. Rep.Congo, Rep.Costa RicaCote d'IvoireCroatiaCubaCyprusCzech RepublicDenmarkDjiboutiDominicaDominican RepublicEarly-demographic dividendEast Asia & PacificEast Asia & Pacific (excluding high income)East Asia & Pacific (IDA & IBRD countries)EcuadorEgypt, Arab Rep.El SalvadorEquatorial GuineaEstoniaEthiopiaEuro areaEurope & Central AsiaEurope & Central Asia (excluding high income)Europe & Central Asia (IDA & IBRD countries)European UnionFaroe IslandsFijiFinlandFragile and conflict affected situationsFranceFrench PolynesiaGabonGambia, TheGeorgiaGermanyGhanaGibraltarGreeceGreenlandGrenadaGuamGuatemalaGuineaGuinea-BissauGuyanaHaitiHeavily indebted poor countries (HIPC)High incomeHondurasHong Kong SAR, ChinaHungaryIBRD onlyIcelandIDA & IBRD totalIDA blendIDA onlyIDA totalIndiaIndonesiaIran, Islamic Rep.IraqIrelandIsraelItalyJamaicaJapanJordanKazakhstanKenyaKiribatiKorea, Dem. People’s Rep.Korea, Rep.KosovoKuwaitKyrgyz RepublicLao PDRLate-demographic dividendLatin America & Caribbean Latin America & Caribbean (excluding high income)Latin America & the Caribbean (IDA & IBRD countries)LatviaLeast developed countries: UN classificationLebanonLiberiaLibyaLithuaniaLow & middle incomeLow incomeLower middle incomeLuxembourgMacao SAR, ChinaMacedonia, FYRMadagascarMalawiMalaysiaMaldivesMaliMaltaMauritaniaMauritiusMexicoMiddle East & North AfricaMiddle East & North Africa (excluding high income)Middle East & North Africa (IDA & IBRD countries)Middle incomeMoldovaMongoliaMontenegroMoroccoMozambiqueMyanmarNauruNepalNetherlandsNew CaledoniaNew ZealandNicaraguaNigerNigeriaNorth AmericaNorwayOECD membersOmanOther small statesPacific island small statesPakistanPanamaPapua New GuineaParaguayPeruPhilippinesPolandPortugalPost-demographic dividendPre-demographic dividendQatarRomaniaRussian FederationRwandaSamoaSao Tome and PrincipeSaudi ArabiaSenegalSerbiaSeychellesSierra LeoneSingaporeSlovak RepublicSloveniaSmall statesSolomon IslandsSomaliaSouth AfricaSouth AsiaSouth Asia (IDA & IBRD)SpainSri LankaSt. Kitts and NevisSt. LuciaSt. Vincent and the GrenadinesSub-Saharan Africa Sub-Saharan Africa (excluding high income)Sub-Saharan Africa (IDA & IBRD countries)SudanSurinameSwedenSwitzerlandSyrian Arab RepublicTajikistanTanzaniaThailandTogoTongaTrinidad and TobagoTunisiaTurkeyTurkmenistanTuvaluUgandaUkraineUnited Arab EmiratesUnited KingdomUnited StatesUpper middle incomeUruguayUzbekistanVanuatuVenezuela, RBVietnamWorldYemen, Rep.ZambiaZimbabwe Timeline:
This timeline shows a graph from 1961 to 2015 of Suriname. No data until 1960. Number of actual observations by date: 54.
Source name:
World Development Indicators
Source organization:
World Bank staff estimates based data from International Monetary Fund's Direction of Trade database.
Categories, topics:
Private Sector, Trade
Last updated:
apr 23, 2017
Indicators value changes by year
Minimum:
72.891
jan 1, 1988
Maximum:
94.559
jan 1, 1962
At the date of observation
Value
Absolute change
Change from previous value
jan 1, 1961
93.566
+93.566
0.0%
jan 1, 1962
94.559
+0.993
1.06%
jan 1, 1964
93.878
-0.682
-0.72%
jan 1, 1965
94.41
+0.532
0.57%
jan 1, 1966
93.172
-1.238
-1.31%
jan 1, 1967
93.868
+0.696
0.75%
jan 1, 1968
91.407
-2.461
-2.62%
jan 1, 1969
91.55
+0.143
0.16%
jan 1, 1970
90.496
-1.054
-1.15%
jan 1, 1971
92.769
+2.273
2.51%
jan 1, 1972
93.937
+1.169
1.26%
jan 1, 1973
93.48
-0.458
-0.49%
jan 1, 1974
92.317
-1.163
-1.24%
jan 1, 1975
92.39
+0.073
0.08%
jan 1, 1976
90.54
-1.85
-2.0%
jan 1, 1977
88.964
-1.576
-1.74%
jan 1, 1978
87.719
-1.245
-1.4%
jan 1, 1979
88.933
+1.214
1.38%
jan 1, 1980
87.077
-1.856
-2.09%
jan 1, 1981
86.783
-0.294
-0.34%
jan 1, 1982
87.269
+0.485
0.56%
jan 1, 1983
86.046
-1.223
-1.4%
jan 1, 1984
81.885
-4.16
-4.83%
jan 1, 1985
75.571
-6.314
-7.71%
jan 1, 1986
77.066
+1.495
1.98%
jan 1, 1987
79.959
+2.893
3.75%
jan 1, 1988
72.891
-7.068
-8.84%
jan 1, 1989
82.53
+9.638
13.22%
jan 1, 1990
87.119
+4.589
5.56%
jan 1, 1991
81.531
-5.588
-6.41%
jan 1, 1992
86.426
+4.895
6.0%
jan 1, 1993
88.235
+1.809
2.09%
jan 1, 1994
89.979
+1.744
1.98%
jan 1, 1995
90.474
+0.495
0.55%
jan 1, 1996
82.33
-8.144
-9.0%
jan 1, 1997
88.922
+6.591
8.01%
jan 1, 1998
87.98
-0.942
-1.06%
jan 1, 1999
87.031
-0.949
-1.08%
jan 1, 2000
85.474
-1.557
-1.79%
jan 1, 2001
80.034
-5.441
-6.37%
jan 1, 2002
78.525
-1.508
-1.88%
jan 1, 2003
80.024
+1.499
1.91%
jan 1, 2004
84.495
+4.471
5.59%
jan 1, 2005
82.092
-2.403
-2.84%
jan 1, 2006
76.476
-5.617
-6.84%
jan 1, 2007
81.199
+4.723
6.18%
jan 1, 2008
78.961
-2.238
-2.76%
jan 1, 2009
78.634
-0.328
-0.41%
jan 1, 2010
79.876
+1.242
1.58%
jan 1, 2011
77.91
-1.966
-2.46%
jan 1, 2012
79.495
+1.585
2.03%
jan 1, 2013
77.031
-2.464
-3.1%
jan 1, 2014
73.939
-3.092
-4.01%
jan 1, 2015
73.394
-0.545
-0.74%
Ranking of countries by current statistics by years


Comments: