29
/
en
AIzaSyAYiBZKx7MnpbEhh9jyipgxe19OcubqV5w
April 1, 2024
161733
Italy
ITA
true
2
1
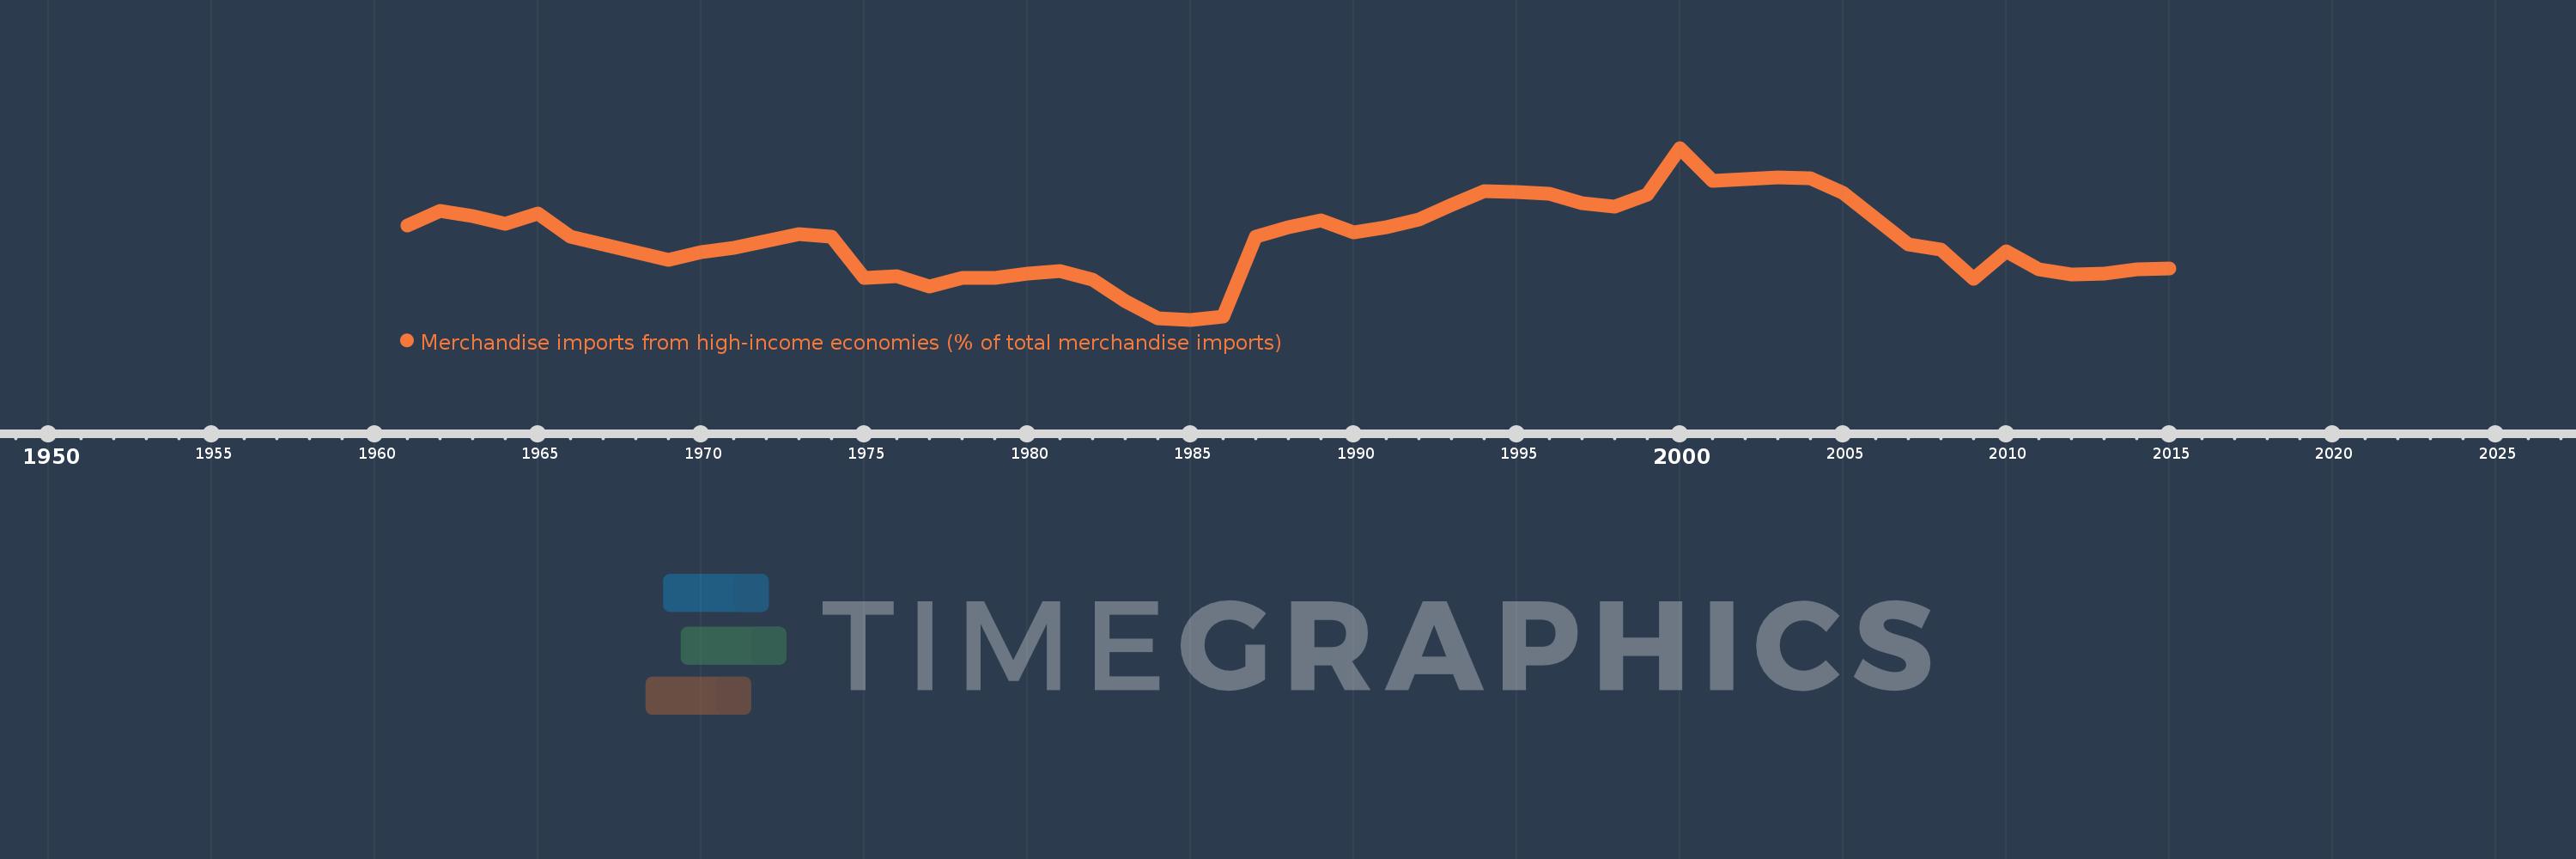
Merchandise imports from high-income economies (% of total merchandise imports)
2015,2014,2013,2012,2011,2010,2009,2008,2007,2006,2005,2004,2003,2002,2001,2000,1999,1998,1997,1996,1995,1994,1993,1992,1991,1990,1989,1988,1987,1986,1985,1984,1983,1982,1981,1980,1979,1978,1977,1976,1975,1974,1973,1972,1971,1970,1969,1968,1967,1966,1965,1964,1963,1962,1961
This statistics in other country:
AfghanistanAlbaniaAlgeriaAngolaAntigua and BarbudaArab WorldArgentinaArmeniaArubaAustraliaAustriaAzerbaijanBahamas, TheBahrainBangladeshBarbadosBelarusBelgiumBelizeBeninBermudaBoliviaBosnia and HerzegovinaBrazilBrunei DarussalamBulgariaBurkina FasoBurundiCabo VerdeCambodiaCameroonCanadaCaribbean small statesCentral African RepublicCentral Europe and the BalticsChadChileChinaColombiaComorosCongo, Dem. Rep.Congo, Rep.Costa RicaCote d'IvoireCroatiaCubaCyprusCzech RepublicDenmarkDjiboutiDominicaDominican RepublicEarly-demographic dividendEast Asia & PacificEast Asia & Pacific (excluding high income)East Asia & Pacific (IDA & IBRD countries)EcuadorEgypt, Arab Rep.El SalvadorEquatorial GuineaEstoniaEthiopiaEuro areaEurope & Central AsiaEurope & Central Asia (excluding high income)Europe & Central Asia (IDA & IBRD countries)European UnionFaroe IslandsFijiFinlandFragile and conflict affected situationsFranceFrench PolynesiaGabonGambia, TheGeorgiaGermanyGhanaGibraltarGreeceGreenlandGrenadaGuamGuatemalaGuineaGuinea-BissauGuyanaHaitiHeavily indebted poor countries (HIPC)High incomeHondurasHong Kong SAR, ChinaHungaryIBRD onlyIcelandIDA & IBRD totalIDA blendIDA onlyIDA totalIndiaIndonesiaIran, Islamic Rep.IraqIrelandIsraelItalyJamaicaJapanJordanKazakhstanKenyaKiribatiKorea, Dem. People’s Rep.Korea, Rep.KosovoKuwaitKyrgyz RepublicLao PDRLate-demographic dividendLatin America & Caribbean Latin America & Caribbean (excluding high income)Latin America & the Caribbean (IDA & IBRD countries)LatviaLeast developed countries: UN classificationLebanonLiberiaLibyaLithuaniaLow & middle incomeLow incomeLower middle incomeLuxembourgMacao SAR, ChinaMacedonia, FYRMadagascarMalawiMalaysiaMaldivesMaliMaltaMauritaniaMauritiusMexicoMiddle East & North AfricaMiddle East & North Africa (excluding high income)Middle East & North Africa (IDA & IBRD countries)Middle incomeMoldovaMongoliaMontenegroMoroccoMozambiqueMyanmarNauruNepalNetherlandsNew CaledoniaNew ZealandNicaraguaNigerNigeriaNorth AmericaNorwayOECD membersOmanOther small statesPacific island small statesPakistanPanamaPapua New GuineaParaguayPeruPhilippinesPolandPortugalPost-demographic dividendPre-demographic dividendQatarRomaniaRussian FederationRwandaSamoaSao Tome and PrincipeSaudi ArabiaSenegalSerbiaSeychellesSierra LeoneSingaporeSlovak RepublicSloveniaSmall statesSolomon IslandsSomaliaSouth AfricaSouth AsiaSouth Asia (IDA & IBRD)SpainSri LankaSt. Kitts and NevisSt. LuciaSt. Vincent and the GrenadinesSub-Saharan Africa Sub-Saharan Africa (excluding high income)Sub-Saharan Africa (IDA & IBRD countries)SudanSurinameSwedenSwitzerlandSyrian Arab RepublicTajikistanTanzaniaThailandTogoTongaTrinidad and TobagoTunisiaTurkeyTurkmenistanTuvaluUgandaUkraineUnited Arab EmiratesUnited KingdomUnited StatesUpper middle incomeUruguayUzbekistanVanuatuVenezuela, RBVietnamWorldYemen, Rep.ZambiaZimbabwe Timeline:
This timeline shows a graph from 1961 to 2015 of Italy. No data until 1960. Number of actual observations by date: 55.
Source name:
World Development Indicators
Source organization:
World Bank staff estimates based data from International Monetary Fund's Direction of Trade database.
Categories, topics:
Private Sector, Trade
Last updated:
apr 23, 2017
Indicators value changes by year
Minimum:
66.773
jan 1, 1985
Maximum:
83.354
jan 1, 2000
At the date of observation
Value
Absolute change
Change from previous value
jan 1, 1961
75.897
+75.897
0.0%
jan 1, 1962
77.237
+1.341
1.77%
jan 1, 1963
76.739
-0.498
-0.64%
jan 1, 1964
76.064
-0.675
-0.88%
jan 1, 1965
77.004
+0.94
1.24%
jan 1, 1966
74.786
-2.218
-2.88%
jan 1, 1967
74.041
-0.745
-1.0%
jan 1, 1968
73.313
-0.728
-0.98%
jan 1, 1969
72.527
-0.786
-1.07%
jan 1, 1970
73.286
+0.759
1.05%
jan 1, 1971
73.747
+0.46
0.63%
jan 1, 1972
74.407
+0.66
0.9%
jan 1, 1973
75.008
+0.602
0.81%
jan 1, 1974
74.76
-0.248
-0.33%
jan 1, 1975
70.792
-3.968
-5.31%
jan 1, 1976
70.953
+0.161
0.23%
jan 1, 1977
70.017
-0.935
-1.32%
jan 1, 1978
70.788
+0.771
1.1%
jan 1, 1979
70.84
+0.052
0.07%
jan 1, 1980
71.259
+0.419
0.59%
jan 1, 1981
71.439
+0.18
0.25%
jan 1, 1982
70.661
-0.778
-1.09%
jan 1, 1983
68.575
-2.086
-2.95%
jan 1, 1984
66.905
-1.67
-2.44%
jan 1, 1985
66.773
-0.132
-0.2%
jan 1, 1986
67.08
+0.307
0.46%
jan 1, 1987
74.817
+7.736
11.53%
jan 1, 1988
75.688
+0.871
1.16%
jan 1, 1989
76.391
+0.703
0.93%
jan 1, 1990
75.23
-1.16
-1.52%
jan 1, 1991
75.674
+0.444
0.59%
jan 1, 1992
76.446
+0.772
1.02%
jan 1, 1993
77.89
+1.444
1.89%
jan 1, 1994
79.177
+1.287
1.65%
jan 1, 1995
79.124
-0.053
-0.07%
jan 1, 1996
78.92
-0.204
-0.26%
jan 1, 1997
78.005
-0.915
-1.16%
jan 1, 1998
77.707
-0.298
-0.38%
jan 1, 1999
78.845
+1.138
1.46%
jan 1, 2000
83.354
+4.509
5.72%
jan 1, 2001
80.186
-3.169
-3.8%
jan 1, 2002
80.371
+0.185
0.23%
jan 1, 2003
80.48
+0.109
0.14%
jan 1, 2004
80.398
-0.082
-0.1%
jan 1, 2005
78.993
-1.405
-1.75%
jan 1, 2006
76.515
-2.478
-3.14%
jan 1, 2007
74.061
-2.454
-3.21%
jan 1, 2008
73.554
-0.507
-0.69%
jan 1, 2009
70.742
-2.811
-3.82%
jan 1, 2010
73.415
+2.672
3.78%
jan 1, 2011
71.65
-1.765
-2.4%
jan 1, 2012
71.18
-0.47
-0.66%
jan 1, 2013
71.234
+0.054
0.08%
jan 1, 2014
71.642
+0.408
0.57%
jan 1, 2015
71.713
+0.07
0.1%
Ranking of countries by current statistics by years


Comments: