29
/
en
AIzaSyAYiBZKx7MnpbEhh9jyipgxe19OcubqV5w
April 1, 2024
55714
Pre-demographic dividend
PRE
false
2
1
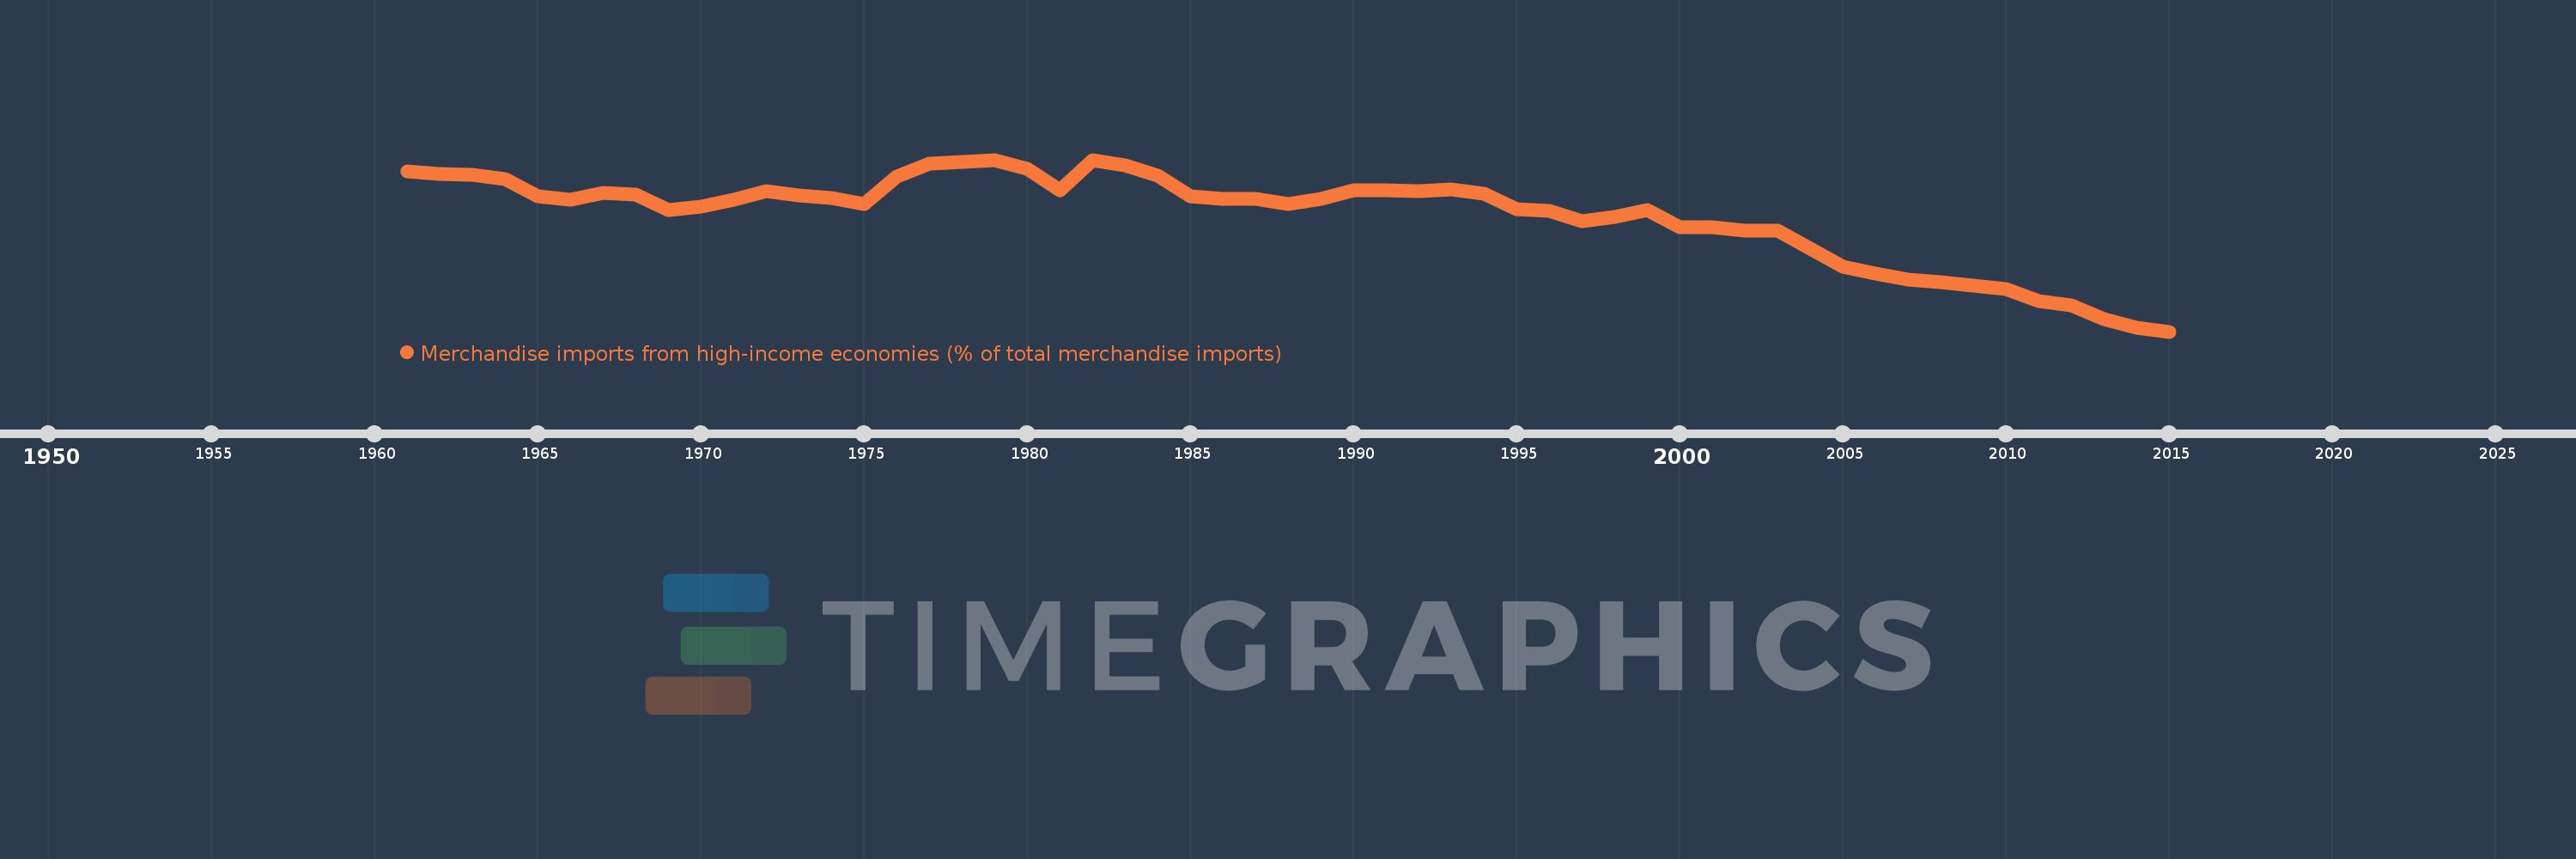
Merchandise imports from high-income economies (% of total merchandise imports)
2015,2014,2013,2012,2011,2010,2009,2008,2007,2006,2005,2004,2003,2002,2001,2000,1999,1998,1997,1996,1995,1994,1993,1992,1991,1990,1989,1988,1987,1986,1985,1984,1983,1982,1981,1980,1979,1978,1977,1976,1975,1974,1973,1972,1971,1970,1969,1968,1967,1966,1965,1964,1963,1962,1961
This statistics in other country:
AfghanistanAlbaniaAlgeriaAngolaAntigua and BarbudaArab WorldArgentinaArmeniaArubaAustraliaAustriaAzerbaijanBahamas, TheBahrainBangladeshBarbadosBelarusBelgiumBelizeBeninBermudaBoliviaBosnia and HerzegovinaBrazilBrunei DarussalamBulgariaBurkina FasoBurundiCabo VerdeCambodiaCameroonCanadaCaribbean small statesCentral African RepublicCentral Europe and the BalticsChadChileChinaColombiaComorosCongo, Dem. Rep.Congo, Rep.Costa RicaCote d'IvoireCroatiaCubaCyprusCzech RepublicDenmarkDjiboutiDominicaDominican RepublicEarly-demographic dividendEast Asia & PacificEast Asia & Pacific (excluding high income)East Asia & Pacific (IDA & IBRD countries)EcuadorEgypt, Arab Rep.El SalvadorEquatorial GuineaEstoniaEthiopiaEuro areaEurope & Central AsiaEurope & Central Asia (excluding high income)Europe & Central Asia (IDA & IBRD countries)European UnionFaroe IslandsFijiFinlandFragile and conflict affected situationsFranceFrench PolynesiaGabonGambia, TheGeorgiaGermanyGhanaGibraltarGreeceGreenlandGrenadaGuamGuatemalaGuineaGuinea-BissauGuyanaHaitiHeavily indebted poor countries (HIPC)High incomeHondurasHong Kong SAR, ChinaHungaryIBRD onlyIcelandIDA & IBRD totalIDA blendIDA onlyIDA totalIndiaIndonesiaIran, Islamic Rep.IraqIrelandIsraelItalyJamaicaJapanJordanKazakhstanKenyaKiribatiKorea, Dem. People’s Rep.Korea, Rep.KosovoKuwaitKyrgyz RepublicLao PDRLate-demographic dividendLatin America & Caribbean Latin America & Caribbean (excluding high income)Latin America & the Caribbean (IDA & IBRD countries)LatviaLeast developed countries: UN classificationLebanonLiberiaLibyaLithuaniaLow & middle incomeLow incomeLower middle incomeLuxembourgMacao SAR, ChinaMacedonia, FYRMadagascarMalawiMalaysiaMaldivesMaliMaltaMauritaniaMauritiusMexicoMiddle East & North AfricaMiddle East & North Africa (excluding high income)Middle East & North Africa (IDA & IBRD countries)Middle incomeMoldovaMongoliaMontenegroMoroccoMozambiqueMyanmarNauruNepalNetherlandsNew CaledoniaNew ZealandNicaraguaNigerNigeriaNorth AmericaNorwayOECD membersOmanOther small statesPacific island small statesPakistanPanamaPapua New GuineaParaguayPeruPhilippinesPolandPortugalPost-demographic dividendPre-demographic dividendQatarRomaniaRussian FederationRwandaSamoaSao Tome and PrincipeSaudi ArabiaSenegalSerbiaSeychellesSierra LeoneSingaporeSlovak RepublicSloveniaSmall statesSolomon IslandsSomaliaSouth AfricaSouth AsiaSouth Asia (IDA & IBRD)SpainSri LankaSt. Kitts and NevisSt. LuciaSt. Vincent and the GrenadinesSub-Saharan Africa Sub-Saharan Africa (excluding high income)Sub-Saharan Africa (IDA & IBRD countries)SudanSurinameSwedenSwitzerlandSyrian Arab RepublicTajikistanTanzaniaThailandTogoTongaTrinidad and TobagoTunisiaTurkeyTurkmenistanTuvaluUgandaUkraineUnited Arab EmiratesUnited KingdomUnited StatesUpper middle incomeUruguayUzbekistanVanuatuVenezuela, RBVietnamWorldYemen, Rep.ZambiaZimbabwe Timeline:
This timeline shows a graph from 1961 to 2015 of Pre-demographic dividend. No data until 1960. Number of actual observations by date: 55.
Source name:
World Development Indicators
Source organization:
World Bank staff estimates based data from International Monetary Fund's Direction of Trade database.
Categories, topics:
Private Sector, Trade
Last updated:
apr 23, 2017
Indicators value changes by year
Minimum:
39.679
jan 1, 2015
Maximum:
80.408
jan 1, 1979
At the date of observation
Value
Absolute change
Change from previous value
jan 1, 1961
77.684
+77.684
0.0%
jan 1, 1962
77.024
-0.66
-0.85%
jan 1, 1963
76.817
-0.207
-0.27%
jan 1, 1964
75.829
-0.988
-1.29%
jan 1, 1965
71.786
-4.043
-5.33%
jan 1, 1966
70.87
-0.916
-1.28%
jan 1, 1967
72.541
+1.671
2.36%
jan 1, 1968
72.138
-0.403
-0.56%
jan 1, 1969
68.46
-3.678
-5.1%
jan 1, 1970
69.393
+0.933
1.36%
jan 1, 1971
70.877
+1.484
2.14%
jan 1, 1972
72.885
+2.008
2.83%
jan 1, 1973
72.027
-0.858
-1.18%
jan 1, 1974
71.328
-0.699
-0.97%
jan 1, 1975
69.965
-1.363
-1.91%
jan 1, 1976
76.437
+6.472
9.25%
jan 1, 1977
79.449
+3.012
3.94%
jan 1, 1978
79.913
+0.464
0.58%
jan 1, 1979
80.408
+0.495
0.62%
jan 1, 1980
78.323
-2.084
-2.59%
jan 1, 1981
73.276
-5.047
-6.44%
jan 1, 1982
80.224
+6.948
9.48%
jan 1, 1983
79.185
-1.039
-1.29%
jan 1, 1984
76.707
-2.478
-3.13%
jan 1, 1985
71.835
-4.872
-6.35%
jan 1, 1986
71.241
-0.594
-0.83%
jan 1, 1987
71.11
-0.131
-0.18%
jan 1, 1988
69.888
-1.222
-1.72%
jan 1, 1989
71.209
+1.321
1.89%
jan 1, 1990
73.187
+1.978
2.78%
jan 1, 1991
73.211
+0.024
0.03%
jan 1, 1992
72.991
-0.22
-0.3%
jan 1, 1993
73.347
+0.356
0.49%
jan 1, 1994
72.329
-1.018
-1.39%
jan 1, 1995
68.788
-3.541
-4.9%
jan 1, 1996
68.242
-0.546
-0.79%
jan 1, 1997
65.882
-2.36
-3.46%
jan 1, 1998
66.843
+0.96
1.46%
jan 1, 1999
68.445
+1.602
2.4%
jan 1, 2000
64.433
-4.012
-5.86%
jan 1, 2001
64.371
-0.062
-0.1%
jan 1, 2002
63.583
-0.788
-1.22%
jan 1, 2003
63.557
-0.026
-0.04%
jan 1, 2004
59.388
-4.169
-6.56%
jan 1, 2005
55.125
-4.264
-7.18%
jan 1, 2006
53.352
-1.772
-3.22%
jan 1, 2007
51.908
-1.444
-2.71%
jan 1, 2008
51.383
-0.525
-1.01%
jan 1, 2009
50.519
-0.864
-1.68%
jan 1, 2010
49.806
-0.713
-1.41%
jan 1, 2011
46.998
-2.808
-5.64%
jan 1, 2012
45.977
-1.021
-2.17%
jan 1, 2013
42.666
-3.311
-7.2%
jan 1, 2014
40.55
-2.116
-4.96%
jan 1, 2015
39.679
-0.871
-2.15%
Ranking of countries by current statistics by years


Comments: