29
/
en
AIzaSyAYiBZKx7MnpbEhh9jyipgxe19OcubqV5w
April 1, 2024
208198
Netherlands
NLD
true
2
1
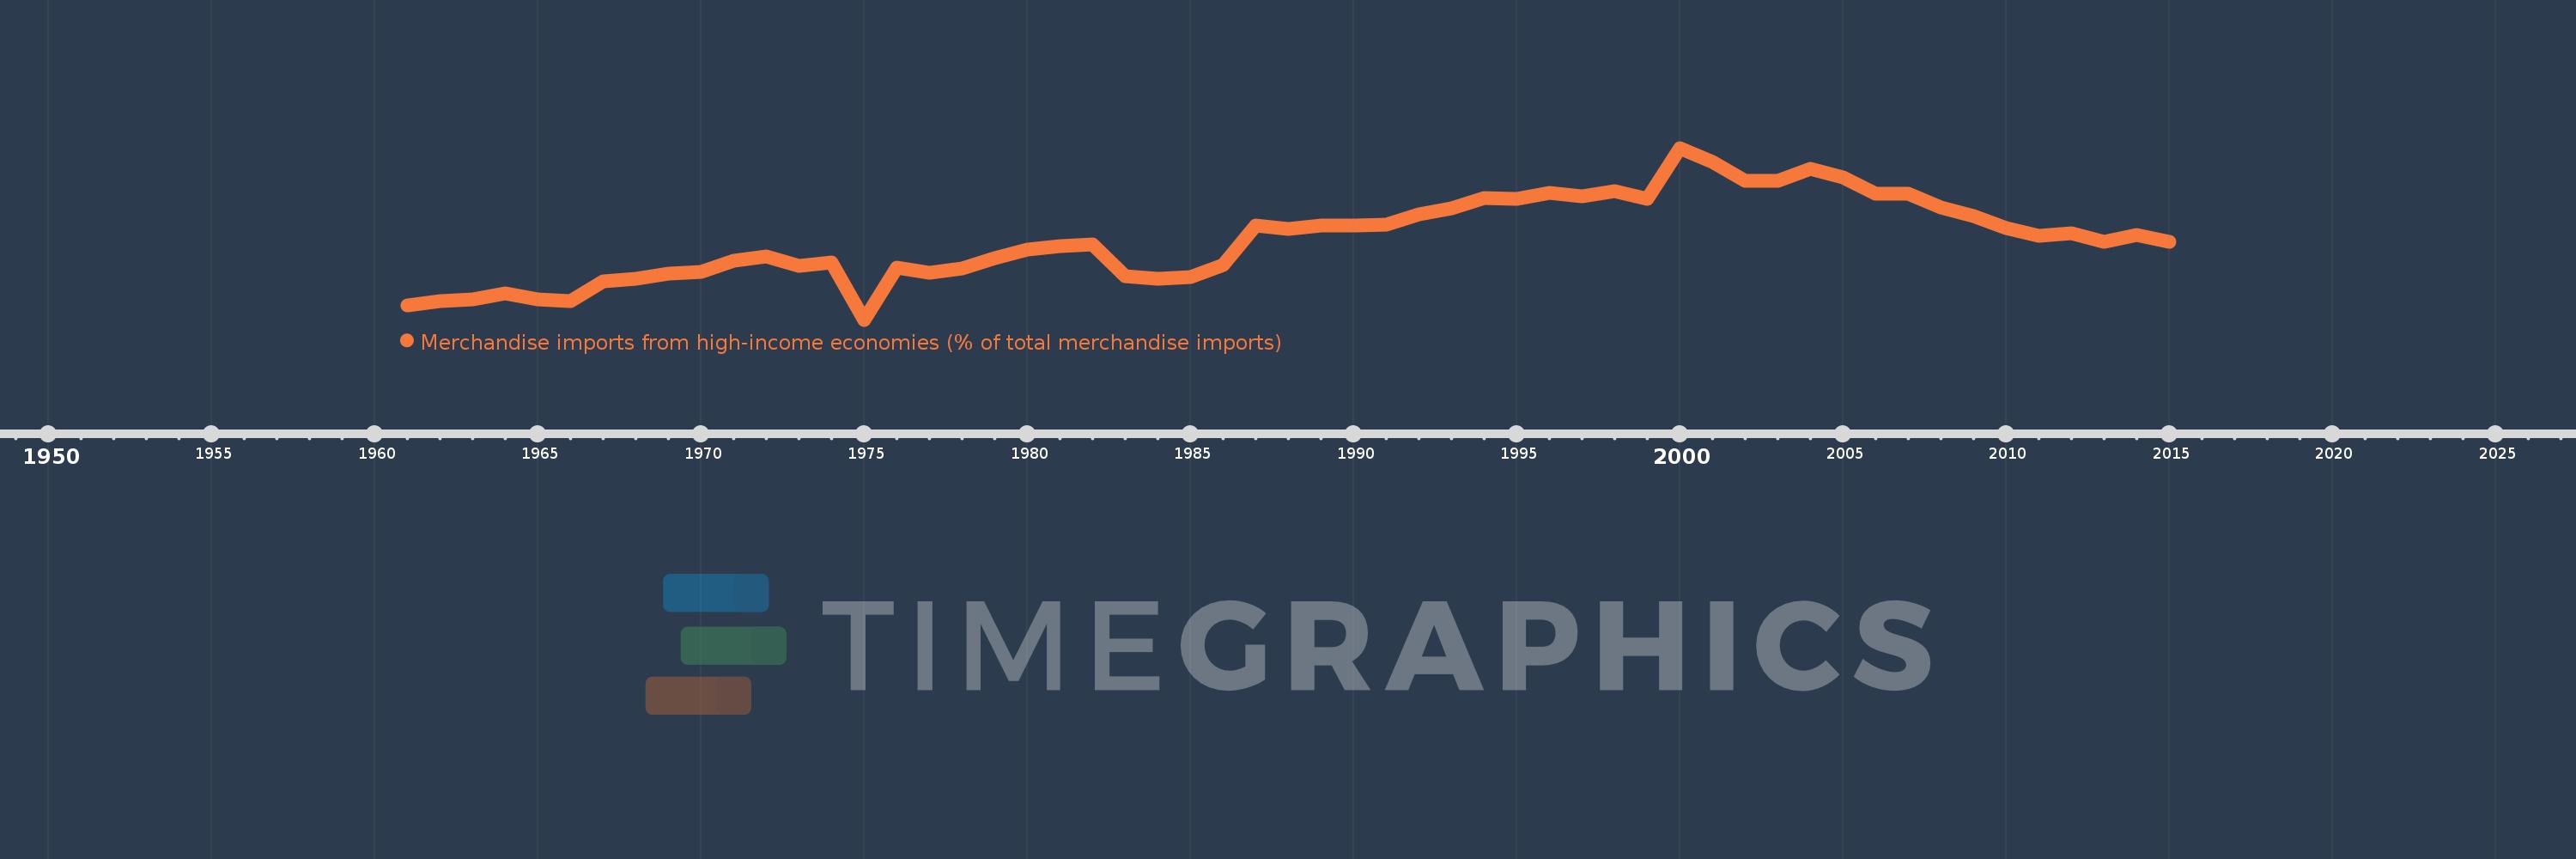
Merchandise imports from high-income economies (% of total merchandise imports)
2015,2014,2013,2012,2011,2010,2009,2008,2007,2006,2005,2004,2003,2002,2001,2000,1999,1998,1997,1996,1995,1994,1993,1992,1991,1990,1989,1988,1987,1986,1985,1984,1983,1982,1981,1980,1979,1978,1977,1976,1975,1974,1973,1972,1971,1970,1969,1968,1967,1966,1965,1964,1963,1962,1961
This statistics in other country:
AfghanistanAlbaniaAlgeriaAngolaAntigua and BarbudaArab WorldArgentinaArmeniaArubaAustraliaAustriaAzerbaijanBahamas, TheBahrainBangladeshBarbadosBelarusBelgiumBelizeBeninBermudaBoliviaBosnia and HerzegovinaBrazilBrunei DarussalamBulgariaBurkina FasoBurundiCabo VerdeCambodiaCameroonCanadaCaribbean small statesCentral African RepublicCentral Europe and the BalticsChadChileChinaColombiaComorosCongo, Dem. Rep.Congo, Rep.Costa RicaCote d'IvoireCroatiaCubaCyprusCzech RepublicDenmarkDjiboutiDominicaDominican RepublicEarly-demographic dividendEast Asia & PacificEast Asia & Pacific (excluding high income)East Asia & Pacific (IDA & IBRD countries)EcuadorEgypt, Arab Rep.El SalvadorEquatorial GuineaEstoniaEthiopiaEuro areaEurope & Central AsiaEurope & Central Asia (excluding high income)Europe & Central Asia (IDA & IBRD countries)European UnionFaroe IslandsFijiFinlandFragile and conflict affected situationsFranceFrench PolynesiaGabonGambia, TheGeorgiaGermanyGhanaGibraltarGreeceGreenlandGrenadaGuamGuatemalaGuineaGuinea-BissauGuyanaHaitiHeavily indebted poor countries (HIPC)High incomeHondurasHong Kong SAR, ChinaHungaryIBRD onlyIcelandIDA & IBRD totalIDA blendIDA onlyIDA totalIndiaIndonesiaIran, Islamic Rep.IraqIrelandIsraelItalyJamaicaJapanJordanKazakhstanKenyaKiribatiKorea, Dem. People’s Rep.Korea, Rep.KosovoKuwaitKyrgyz RepublicLao PDRLate-demographic dividendLatin America & Caribbean Latin America & Caribbean (excluding high income)Latin America & the Caribbean (IDA & IBRD countries)LatviaLeast developed countries: UN classificationLebanonLiberiaLibyaLithuaniaLow & middle incomeLow incomeLower middle incomeLuxembourgMacao SAR, ChinaMacedonia, FYRMadagascarMalawiMalaysiaMaldivesMaliMaltaMauritaniaMauritiusMexicoMiddle East & North AfricaMiddle East & North Africa (excluding high income)Middle East & North Africa (IDA & IBRD countries)Middle incomeMoldovaMongoliaMontenegroMoroccoMozambiqueMyanmarNauruNepalNetherlandsNew CaledoniaNew ZealandNicaraguaNigerNigeriaNorth AmericaNorwayOECD membersOmanOther small statesPacific island small statesPakistanPanamaPapua New GuineaParaguayPeruPhilippinesPolandPortugalPost-demographic dividendPre-demographic dividendQatarRomaniaRussian FederationRwandaSamoaSao Tome and PrincipeSaudi ArabiaSenegalSerbiaSeychellesSierra LeoneSingaporeSlovak RepublicSloveniaSmall statesSolomon IslandsSomaliaSouth AfricaSouth AsiaSouth Asia (IDA & IBRD)SpainSri LankaSt. Kitts and NevisSt. LuciaSt. Vincent and the GrenadinesSub-Saharan Africa Sub-Saharan Africa (excluding high income)Sub-Saharan Africa (IDA & IBRD countries)SudanSurinameSwedenSwitzerlandSyrian Arab RepublicTajikistanTanzaniaThailandTogoTongaTrinidad and TobagoTunisiaTurkeyTurkmenistanTuvaluUgandaUkraineUnited Arab EmiratesUnited KingdomUnited StatesUpper middle incomeUruguayUzbekistanVanuatuVenezuela, RBVietnamWorldYemen, Rep.ZambiaZimbabwe Timeline:
This timeline shows a graph from 1961 to 2015 of Netherlands. No data until 1960. Number of actual observations by date: 55.
Source name:
World Development Indicators
Source organization:
World Bank staff estimates based data from International Monetary Fund's Direction of Trade database.
Categories, topics:
Private Sector, Trade
Last updated:
apr 23, 2017
Indicators value changes by year
Minimum:
64.116
jan 1, 1975
At the date of observation
Value
Absolute change
Change from previous value
jan 1, 1961
65.76
+65.76
0.0%
jan 1, 1962
66.175
+0.415
0.63%
jan 1, 1963
66.425
+0.25
0.38%
jan 1, 1964
67.133
+0.709
1.07%
jan 1, 1965
66.465
-0.668
-1.0%
jan 1, 1966
66.265
-0.2
-0.3%
jan 1, 1967
68.48
+2.215
3.34%
jan 1, 1968
68.711
+0.231
0.34%
jan 1, 1969
69.313
+0.602
0.88%
jan 1, 1970
69.569
+0.257
0.37%
jan 1, 1971
70.771
+1.202
1.73%
jan 1, 1972
71.311
+0.54
0.76%
jan 1, 1973
70.247
-1.063
-1.49%
jan 1, 1974
70.582
+0.335
0.48%
jan 1, 1975
64.116
-6.466
-9.16%
jan 1, 1976
70.046
+5.93
9.25%
jan 1, 1977
69.446
-0.599
-0.86%
jan 1, 1978
69.953
+0.507
0.73%
jan 1, 1979
71.127
+1.174
1.68%
jan 1, 1980
72.061
+0.934
1.31%
jan 1, 1981
72.406
+0.345
0.48%
jan 1, 1982
72.655
+0.248
0.34%
jan 1, 1983
69.018
-3.637
-5.01%
jan 1, 1984
68.708
-0.31
-0.45%
jan 1, 1985
68.906
+0.198
0.29%
jan 1, 1986
70.292
+1.386
2.01%
jan 1, 1987
74.741
+4.448
6.33%
jan 1, 1988
74.343
-0.398
-0.53%
jan 1, 1989
74.791
+0.448
0.6%
jan 1, 1990
74.812
+0.021
0.03%
jan 1, 1991
74.829
+0.017
0.02%
jan 1, 1992
76.013
+1.184
1.58%
jan 1, 1993
76.677
+0.664
0.87%
jan 1, 1994
77.925
+1.248
1.63%
jan 1, 1995
77.77
-0.155
-0.2%
jan 1, 1996
78.453
+0.684
0.88%
jan 1, 1997
78.06
-0.394
-0.5%
jan 1, 1998
78.658
+0.599
0.77%
jan 1, 1999
77.791
-0.868
-1.1%
jan 1, 2000
83.54
+5.75
7.39%
jan 1, 2001
81.959
-1.581
-1.89%
jan 1, 2002
79.849
-2.11
-2.57%
jan 1, 2003
79.808
-0.041
-0.05%
jan 1, 2004
81.136
+1.328
1.66%
jan 1, 2005
80.23
-0.906
-1.12%
jan 1, 2006
78.411
-1.818
-2.27%
jan 1, 2007
78.403
-0.008
-0.01%
jan 1, 2008
76.809
-1.594
-2.03%
jan 1, 2009
75.822
-0.988
-1.29%
jan 1, 2010
74.503
-1.319
-1.74%
jan 1, 2011
73.595
-0.908
-1.22%
jan 1, 2012
73.888
+0.293
0.4%
jan 1, 2013
72.956
-0.932
-1.26%
jan 1, 2014
73.688
+0.732
1.0%
jan 1, 2015
72.88
-0.808
-1.1%
Ranking of countries by current statistics by years


Comments: