29
/
en
AIzaSyAYiBZKx7MnpbEhh9jyipgxe19OcubqV5w
April 1, 2024
25909
Central Europe and the Baltics
CEB
false
2
1
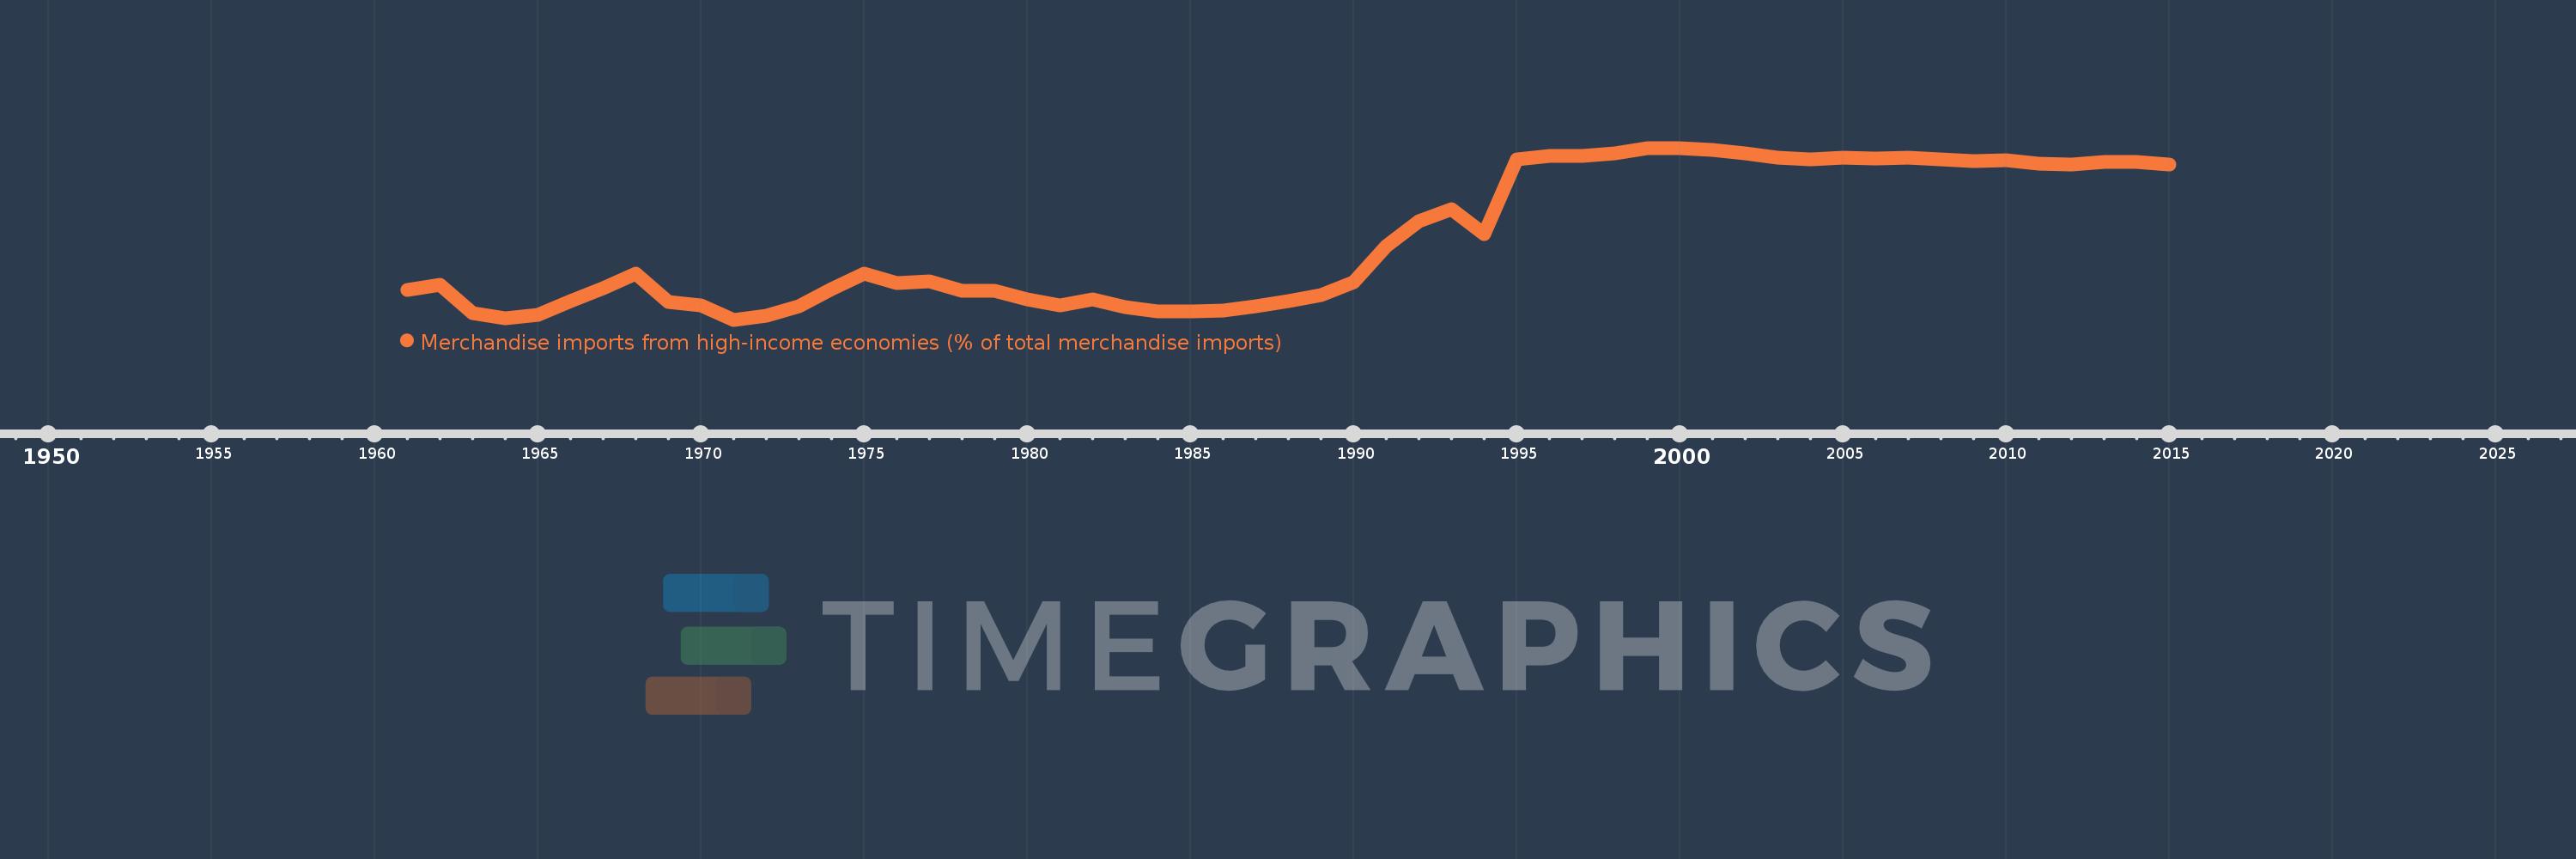
Merchandise imports from high-income economies (% of total merchandise imports)
2015,2014,2013,2012,2011,2010,2009,2008,2007,2006,2005,2004,2003,2002,2001,2000,1999,1998,1997,1996,1995,1994,1993,1992,1991,1990,1989,1988,1987,1986,1985,1984,1983,1982,1981,1980,1979,1978,1977,1976,1975,1974,1973,1972,1971,1970,1969,1968,1967,1966,1965,1964,1963,1962,1961
This statistics in other country:
AfghanistanAlbaniaAlgeriaAngolaAntigua and BarbudaArab WorldArgentinaArmeniaArubaAustraliaAustriaAzerbaijanBahamas, TheBahrainBangladeshBarbadosBelarusBelgiumBelizeBeninBermudaBoliviaBosnia and HerzegovinaBrazilBrunei DarussalamBulgariaBurkina FasoBurundiCabo VerdeCambodiaCameroonCanadaCaribbean small statesCentral African RepublicCentral Europe and the BalticsChadChileChinaColombiaComorosCongo, Dem. Rep.Congo, Rep.Costa RicaCote d'IvoireCroatiaCubaCyprusCzech RepublicDenmarkDjiboutiDominicaDominican RepublicEarly-demographic dividendEast Asia & PacificEast Asia & Pacific (excluding high income)East Asia & Pacific (IDA & IBRD countries)EcuadorEgypt, Arab Rep.El SalvadorEquatorial GuineaEstoniaEthiopiaEuro areaEurope & Central AsiaEurope & Central Asia (excluding high income)Europe & Central Asia (IDA & IBRD countries)European UnionFaroe IslandsFijiFinlandFragile and conflict affected situationsFranceFrench PolynesiaGabonGambia, TheGeorgiaGermanyGhanaGibraltarGreeceGreenlandGrenadaGuamGuatemalaGuineaGuinea-BissauGuyanaHaitiHeavily indebted poor countries (HIPC)High incomeHondurasHong Kong SAR, ChinaHungaryIBRD onlyIcelandIDA & IBRD totalIDA blendIDA onlyIDA totalIndiaIndonesiaIran, Islamic Rep.IraqIrelandIsraelItalyJamaicaJapanJordanKazakhstanKenyaKiribatiKorea, Dem. People’s Rep.Korea, Rep.KosovoKuwaitKyrgyz RepublicLao PDRLate-demographic dividendLatin America & Caribbean Latin America & Caribbean (excluding high income)Latin America & the Caribbean (IDA & IBRD countries)LatviaLeast developed countries: UN classificationLebanonLiberiaLibyaLithuaniaLow & middle incomeLow incomeLower middle incomeLuxembourgMacao SAR, ChinaMacedonia, FYRMadagascarMalawiMalaysiaMaldivesMaliMaltaMauritaniaMauritiusMexicoMiddle East & North AfricaMiddle East & North Africa (excluding high income)Middle East & North Africa (IDA & IBRD countries)Middle incomeMoldovaMongoliaMontenegroMoroccoMozambiqueMyanmarNauruNepalNetherlandsNew CaledoniaNew ZealandNicaraguaNigerNigeriaNorth AmericaNorwayOECD membersOmanOther small statesPacific island small statesPakistanPanamaPapua New GuineaParaguayPeruPhilippinesPolandPortugalPost-demographic dividendPre-demographic dividendQatarRomaniaRussian FederationRwandaSamoaSao Tome and PrincipeSaudi ArabiaSenegalSerbiaSeychellesSierra LeoneSingaporeSlovak RepublicSloveniaSmall statesSolomon IslandsSomaliaSouth AfricaSouth AsiaSouth Asia (IDA & IBRD)SpainSri LankaSt. Kitts and NevisSt. LuciaSt. Vincent and the GrenadinesSub-Saharan Africa Sub-Saharan Africa (excluding high income)Sub-Saharan Africa (IDA & IBRD countries)SudanSurinameSwedenSwitzerlandSyrian Arab RepublicTajikistanTanzaniaThailandTogoTongaTrinidad and TobagoTunisiaTurkeyTurkmenistanTuvaluUgandaUkraineUnited Arab EmiratesUnited KingdomUnited StatesUpper middle incomeUruguayUzbekistanVanuatuVenezuela, RBVietnamWorldYemen, Rep.ZambiaZimbabwe Timeline:
This timeline shows a graph from 1961 to 2015 of Central Europe and the Baltics. No data until 1960. Number of actual observations by date: 55.
Source name:
World Development Indicators
Source organization:
World Bank staff estimates based data from International Monetary Fund's Direction of Trade database.
Categories, topics:
Private Sector, Trade
Last updated:
apr 23, 2017
Indicators value changes by year
Minimum:
33.088
jan 1, 1971
Maximum:
90.785
jan 1, 2000
At the date of observation
Value
Absolute change
Change from previous value
jan 1, 1961
43.13
+43.13
0.0%
jan 1, 1962
44.84
+1.711
3.97%
jan 1, 1963
35.31
-9.53
-21.25%
jan 1, 1964
33.675
-1.635
-4.63%
jan 1, 1965
34.706
+1.03
3.06%
jan 1, 1966
39.209
+4.503
12.98%
jan 1, 1967
43.689
+4.48
11.43%
jan 1, 1968
48.635
+4.946
11.32%
jan 1, 1969
38.968
-9.667
-19.88%
jan 1, 1970
38.001
-0.968
-2.48%
jan 1, 1971
33.088
-4.912
-12.93%
jan 1, 1972
34.31
+1.222
3.69%
jan 1, 1973
37.622
+3.312
9.65%
jan 1, 1974
43.396
+5.774
15.35%
jan 1, 1975
48.509
+5.113
11.78%
jan 1, 1976
45.39
-3.119
-6.43%
jan 1, 1977
46.001
+0.611
1.35%
jan 1, 1978
42.81
-3.191
-6.94%
jan 1, 1979
42.784
-0.025
-0.06%
jan 1, 1980
40.007
-2.777
-6.49%
jan 1, 1981
37.935
-2.072
-5.18%
jan 1, 1982
39.867
+1.932
5.09%
jan 1, 1983
37.204
-2.663
-6.68%
jan 1, 1984
35.758
-1.446
-3.89%
jan 1, 1985
35.96
+0.202
0.56%
jan 1, 1986
36.278
+0.318
0.88%
jan 1, 1987
37.577
+1.3
3.58%
jan 1, 1988
39.39
+1.812
4.82%
jan 1, 1989
41.273
+1.883
4.78%
jan 1, 1990
45.769
+4.496
10.89%
jan 1, 1991
57.709
+11.939
26.09%
jan 1, 1992
66.222
+8.514
14.75%
jan 1, 1993
70.123
+3.901
5.89%
jan 1, 1994
61.712
-8.411
-11.99%
jan 1, 1995
86.852
+25.14
40.74%
jan 1, 1996
88.217
+1.365
1.57%
jan 1, 1997
88.097
-0.119
-0.14%
jan 1, 1998
88.869
+0.772
0.88%
jan 1, 1999
90.694
+1.824
2.05%
jan 1, 2000
90.785
+0.091
0.1%
jan 1, 2001
90.018
-0.767
-0.85%
jan 1, 2002
88.847
-1.171
-1.3%
jan 1, 2003
87.467
-1.38
-1.55%
jan 1, 2004
86.997
-0.47
-0.54%
jan 1, 2005
87.491
+0.494
0.57%
jan 1, 2006
87.334
-0.157
-0.18%
jan 1, 2007
87.557
+0.223
0.25%
jan 1, 2008
87.043
-0.514
-0.59%
jan 1, 2009
86.34
-0.703
-0.81%
jan 1, 2010
86.543
+0.203
0.24%
jan 1, 2011
85.527
-1.016
-1.17%
jan 1, 2012
85.343
-0.185
-0.22%
jan 1, 2013
86.027
+0.684
0.8%
jan 1, 2014
86.142
+0.116
0.13%
jan 1, 2015
85.328
-0.814
-0.95%
Ranking of countries by current statistics by years


Comments: