29
/
en
AIzaSyAYiBZKx7MnpbEhh9jyipgxe19OcubqV5w
April 1, 2024
30069
Euro area
EMU
false
2
1
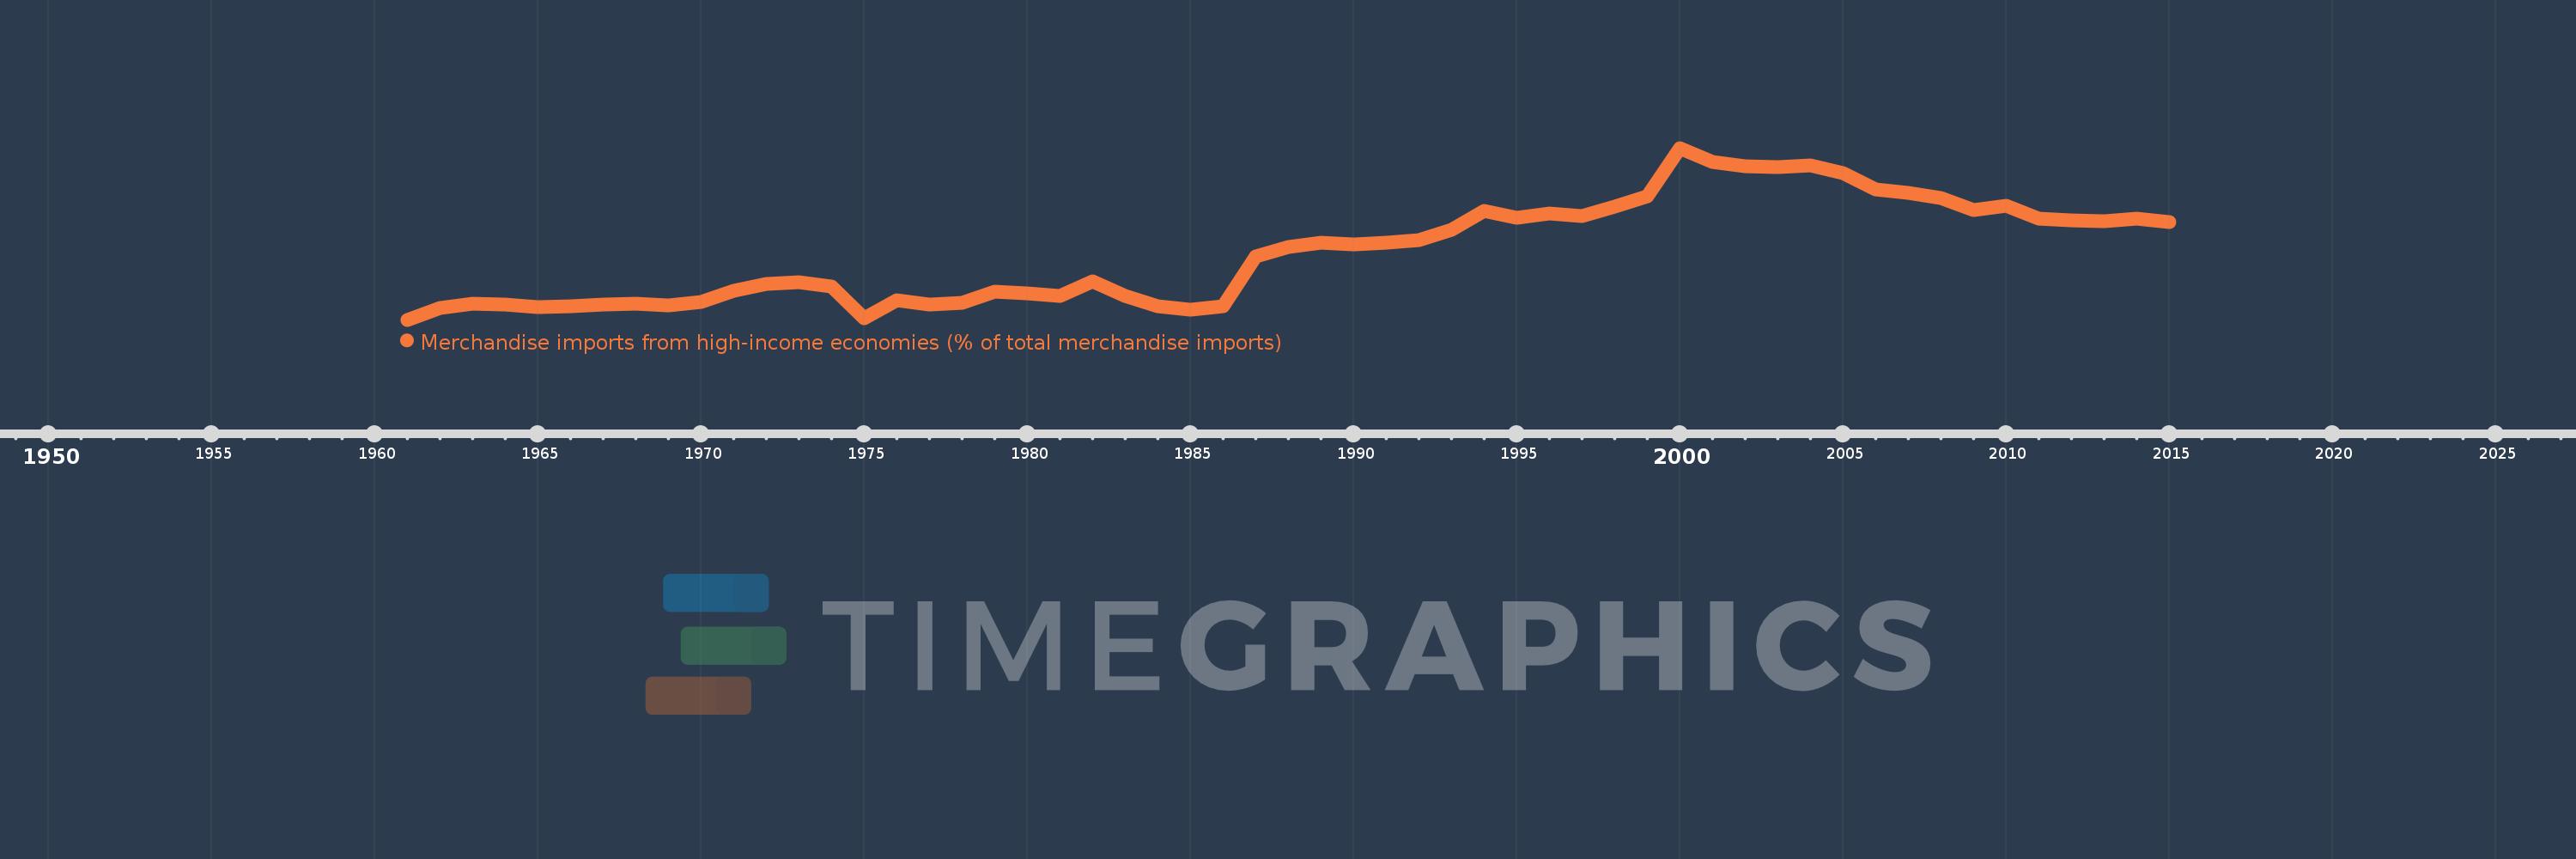
Merchandise imports from high-income economies (% of total merchandise imports)
2015,2014,2013,2012,2011,2010,2009,2008,2007,2006,2005,2004,2003,2002,2001,2000,1999,1998,1997,1996,1995,1994,1993,1992,1991,1990,1989,1988,1987,1986,1985,1984,1983,1982,1981,1980,1979,1978,1977,1976,1975,1974,1973,1972,1971,1970,1969,1968,1967,1966,1965,1964,1963,1962,1961
This statistics in other country:
AfghanistanAlbaniaAlgeriaAngolaAntigua and BarbudaArab WorldArgentinaArmeniaArubaAustraliaAustriaAzerbaijanBahamas, TheBahrainBangladeshBarbadosBelarusBelgiumBelizeBeninBermudaBoliviaBosnia and HerzegovinaBrazilBrunei DarussalamBulgariaBurkina FasoBurundiCabo VerdeCambodiaCameroonCanadaCaribbean small statesCentral African RepublicCentral Europe and the BalticsChadChileChinaColombiaComorosCongo, Dem. Rep.Congo, Rep.Costa RicaCote d'IvoireCroatiaCubaCyprusCzech RepublicDenmarkDjiboutiDominicaDominican RepublicEarly-demographic dividendEast Asia & PacificEast Asia & Pacific (excluding high income)East Asia & Pacific (IDA & IBRD countries)EcuadorEgypt, Arab Rep.El SalvadorEquatorial GuineaEstoniaEthiopiaEuro areaEurope & Central AsiaEurope & Central Asia (excluding high income)Europe & Central Asia (IDA & IBRD countries)European UnionFaroe IslandsFijiFinlandFragile and conflict affected situationsFranceFrench PolynesiaGabonGambia, TheGeorgiaGermanyGhanaGibraltarGreeceGreenlandGrenadaGuamGuatemalaGuineaGuinea-BissauGuyanaHaitiHeavily indebted poor countries (HIPC)High incomeHondurasHong Kong SAR, ChinaHungaryIBRD onlyIcelandIDA & IBRD totalIDA blendIDA onlyIDA totalIndiaIndonesiaIran, Islamic Rep.IraqIrelandIsraelItalyJamaicaJapanJordanKazakhstanKenyaKiribatiKorea, Dem. People’s Rep.Korea, Rep.KosovoKuwaitKyrgyz RepublicLao PDRLate-demographic dividendLatin America & Caribbean Latin America & Caribbean (excluding high income)Latin America & the Caribbean (IDA & IBRD countries)LatviaLeast developed countries: UN classificationLebanonLiberiaLibyaLithuaniaLow & middle incomeLow incomeLower middle incomeLuxembourgMacao SAR, ChinaMacedonia, FYRMadagascarMalawiMalaysiaMaldivesMaliMaltaMauritaniaMauritiusMexicoMiddle East & North AfricaMiddle East & North Africa (excluding high income)Middle East & North Africa (IDA & IBRD countries)Middle incomeMoldovaMongoliaMontenegroMoroccoMozambiqueMyanmarNauruNepalNetherlandsNew CaledoniaNew ZealandNicaraguaNigerNigeriaNorth AmericaNorwayOECD membersOmanOther small statesPacific island small statesPakistanPanamaPapua New GuineaParaguayPeruPhilippinesPolandPortugalPost-demographic dividendPre-demographic dividendQatarRomaniaRussian FederationRwandaSamoaSao Tome and PrincipeSaudi ArabiaSenegalSerbiaSeychellesSierra LeoneSingaporeSlovak RepublicSloveniaSmall statesSolomon IslandsSomaliaSouth AfricaSouth AsiaSouth Asia (IDA & IBRD)SpainSri LankaSt. Kitts and NevisSt. LuciaSt. Vincent and the GrenadinesSub-Saharan Africa Sub-Saharan Africa (excluding high income)Sub-Saharan Africa (IDA & IBRD countries)SudanSurinameSwedenSwitzerlandSyrian Arab RepublicTajikistanTanzaniaThailandTogoTongaTrinidad and TobagoTunisiaTurkeyTurkmenistanTuvaluUgandaUkraineUnited Arab EmiratesUnited KingdomUnited StatesUpper middle incomeUruguayUzbekistanVanuatuVenezuela, RBVietnamWorldYemen, Rep.ZambiaZimbabwe Timeline:
This timeline shows a graph from 1961 to 2015 of Euro area. No data until 1960. Number of actual observations by date: 55.
Source name:
World Development Indicators
Source organization:
World Bank staff estimates based data from International Monetary Fund's Direction of Trade database.
Categories, topics:
Private Sector, Trade
Last updated:
apr 23, 2017
Indicators value changes by year
Minimum:
70.815
jan 1, 1961
Maximum:
87.359
jan 1, 2000
At the date of observation
Value
Absolute change
Change from previous value
jan 1, 1961
70.815
+70.815
0.0%
jan 1, 1962
71.914
+1.099
1.55%
jan 1, 1963
72.343
+0.429
0.6%
jan 1, 1964
72.251
-0.093
-0.13%
jan 1, 1965
71.991
-0.26
-0.36%
jan 1, 1966
72.14
+0.149
0.21%
jan 1, 1967
72.255
+0.116
0.16%
jan 1, 1968
72.351
+0.096
0.13%
jan 1, 1969
72.169
-0.183
-0.25%
jan 1, 1970
72.487
+0.319
0.44%
jan 1, 1971
73.588
+1.101
1.52%
jan 1, 1972
74.273
+0.685
0.93%
jan 1, 1973
74.416
+0.143
0.19%
jan 1, 1974
74.004
-0.412
-0.55%
jan 1, 1975
70.978
-3.026
-4.09%
jan 1, 1976
72.681
+1.703
2.4%
jan 1, 1977
72.302
-0.379
-0.52%
jan 1, 1978
72.445
+0.143
0.2%
jan 1, 1979
73.508
+1.064
1.47%
jan 1, 1980
73.328
-0.18
-0.24%
jan 1, 1981
73.074
-0.254
-0.35%
jan 1, 1982
74.489
+1.415
1.94%
jan 1, 1983
73.087
-1.402
-1.88%
jan 1, 1984
72.152
-0.935
-1.28%
jan 1, 1985
71.744
-0.408
-0.57%
jan 1, 1986
72.116
+0.371
0.52%
jan 1, 1987
76.917
+4.801
6.66%
jan 1, 1988
77.804
+0.887
1.15%
jan 1, 1989
78.243
+0.439
0.56%
jan 1, 1990
78.031
-0.212
-0.27%
jan 1, 1991
78.234
+0.203
0.26%
jan 1, 1992
78.502
+0.267
0.34%
jan 1, 1993
79.517
+1.015
1.29%
jan 1, 1994
81.271
+1.754
2.21%
jan 1, 1995
80.638
-0.634
-0.78%
jan 1, 1996
81.021
+0.383
0.48%
jan 1, 1997
80.785
-0.236
-0.29%
jan 1, 1998
81.697
+0.911
1.13%
jan 1, 1999
82.712
+1.015
1.24%
jan 1, 2000
87.359
+4.648
5.62%
jan 1, 2001
86.008
-1.351
-1.55%
jan 1, 2002
85.633
-0.375
-0.44%
jan 1, 2003
85.524
-0.109
-0.13%
jan 1, 2004
85.666
+0.142
0.17%
jan 1, 2005
84.905
-0.761
-0.89%
jan 1, 2006
83.375
-1.529
-1.8%
jan 1, 2007
83.058
-0.317
-0.38%
jan 1, 2008
82.51
-0.548
-0.66%
jan 1, 2009
81.356
-1.154
-1.4%
jan 1, 2010
81.821
+0.465
0.57%
jan 1, 2011
80.579
-1.243
-1.52%
jan 1, 2012
80.395
-0.184
-0.23%
jan 1, 2013
80.266
-0.129
-0.16%
jan 1, 2014
80.591
+0.325
0.4%
jan 1, 2015
80.25
-0.341
-0.42%
Ranking of countries by current statistics by years


Comments: