29
/
en
AIzaSyAYiBZKx7MnpbEhh9jyipgxe19OcubqV5w
April 1, 2024
91442
Brazil
BRA
true
2
1
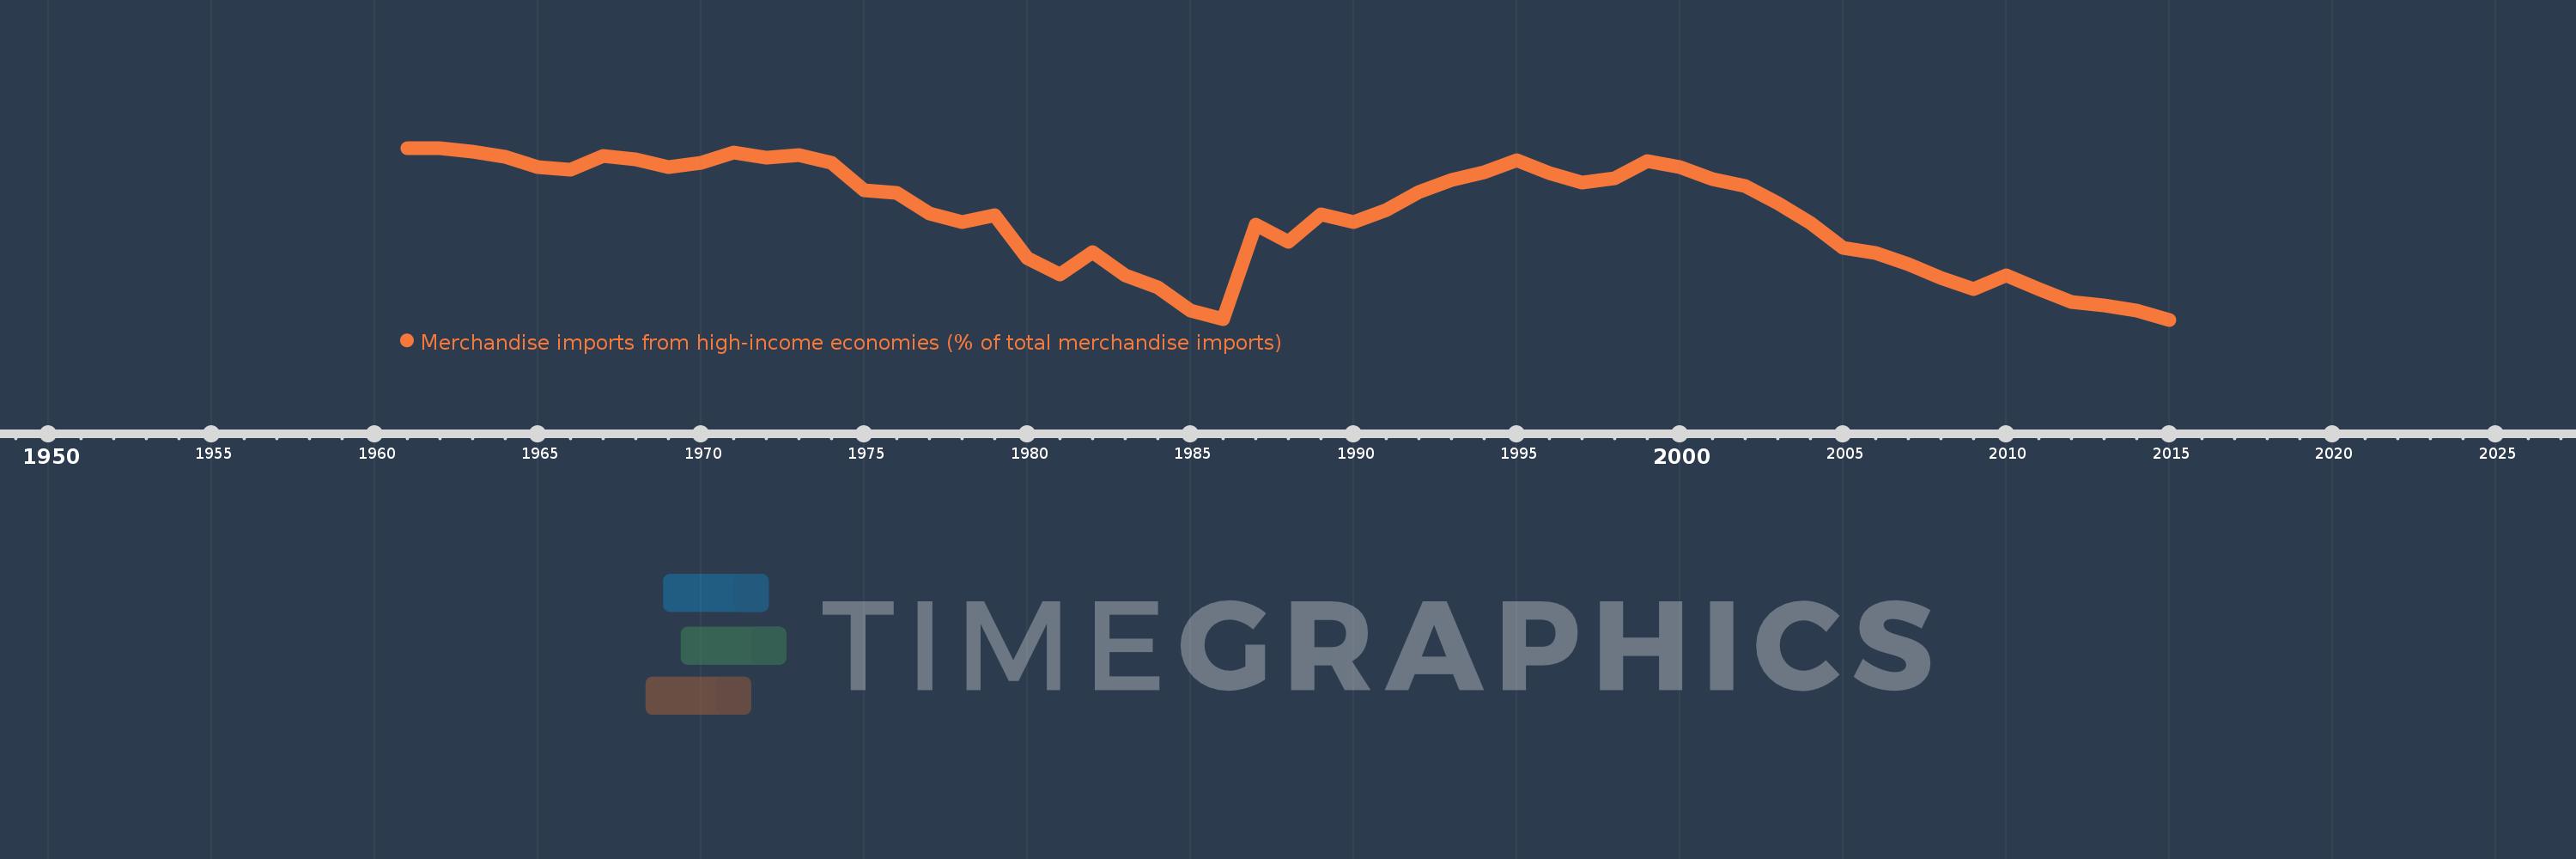
Merchandise imports from high-income economies (% of total merchandise imports)
2015,2014,2013,2012,2011,2010,2009,2008,2007,2006,2005,2004,2003,2002,2001,2000,1999,1998,1997,1996,1995,1994,1993,1992,1991,1990,1989,1988,1987,1986,1985,1984,1983,1982,1981,1980,1979,1978,1977,1976,1975,1974,1973,1972,1971,1970,1969,1968,1967,1966,1965,1964,1963,1962,1961
This statistics in other country:
AfghanistanAlbaniaAlgeriaAngolaAntigua and BarbudaArab WorldArgentinaArmeniaArubaAustraliaAustriaAzerbaijanBahamas, TheBahrainBangladeshBarbadosBelarusBelgiumBelizeBeninBermudaBoliviaBosnia and HerzegovinaBrazilBrunei DarussalamBulgariaBurkina FasoBurundiCabo VerdeCambodiaCameroonCanadaCaribbean small statesCentral African RepublicCentral Europe and the BalticsChadChileChinaColombiaComorosCongo, Dem. Rep.Congo, Rep.Costa RicaCote d'IvoireCroatiaCubaCyprusCzech RepublicDenmarkDjiboutiDominicaDominican RepublicEarly-demographic dividendEast Asia & PacificEast Asia & Pacific (excluding high income)East Asia & Pacific (IDA & IBRD countries)EcuadorEgypt, Arab Rep.El SalvadorEquatorial GuineaEstoniaEthiopiaEuro areaEurope & Central AsiaEurope & Central Asia (excluding high income)Europe & Central Asia (IDA & IBRD countries)European UnionFaroe IslandsFijiFinlandFragile and conflict affected situationsFranceFrench PolynesiaGabonGambia, TheGeorgiaGermanyGhanaGibraltarGreeceGreenlandGrenadaGuamGuatemalaGuineaGuinea-BissauGuyanaHaitiHeavily indebted poor countries (HIPC)High incomeHondurasHong Kong SAR, ChinaHungaryIBRD onlyIcelandIDA & IBRD totalIDA blendIDA onlyIDA totalIndiaIndonesiaIran, Islamic Rep.IraqIrelandIsraelItalyJamaicaJapanJordanKazakhstanKenyaKiribatiKorea, Dem. People’s Rep.Korea, Rep.KosovoKuwaitKyrgyz RepublicLao PDRLate-demographic dividendLatin America & Caribbean Latin America & Caribbean (excluding high income)Latin America & the Caribbean (IDA & IBRD countries)LatviaLeast developed countries: UN classificationLebanonLiberiaLibyaLithuaniaLow & middle incomeLow incomeLower middle incomeLuxembourgMacao SAR, ChinaMacedonia, FYRMadagascarMalawiMalaysiaMaldivesMaliMaltaMauritaniaMauritiusMexicoMiddle East & North AfricaMiddle East & North Africa (excluding high income)Middle East & North Africa (IDA & IBRD countries)Middle incomeMoldovaMongoliaMontenegroMoroccoMozambiqueMyanmarNauruNepalNetherlandsNew CaledoniaNew ZealandNicaraguaNigerNigeriaNorth AmericaNorwayOECD membersOmanOther small statesPacific island small statesPakistanPanamaPapua New GuineaParaguayPeruPhilippinesPolandPortugalPost-demographic dividendPre-demographic dividendQatarRomaniaRussian FederationRwandaSamoaSao Tome and PrincipeSaudi ArabiaSenegalSerbiaSeychellesSierra LeoneSingaporeSlovak RepublicSloveniaSmall statesSolomon IslandsSomaliaSouth AfricaSouth AsiaSouth Asia (IDA & IBRD)SpainSri LankaSt. Kitts and NevisSt. LuciaSt. Vincent and the GrenadinesSub-Saharan Africa Sub-Saharan Africa (excluding high income)Sub-Saharan Africa (IDA & IBRD countries)SudanSurinameSwedenSwitzerlandSyrian Arab RepublicTajikistanTanzaniaThailandTogoTongaTrinidad and TobagoTunisiaTurkeyTurkmenistanTuvaluUgandaUkraineUnited Arab EmiratesUnited KingdomUnited StatesUpper middle incomeUruguayUzbekistanVanuatuVenezuela, RBVietnamWorldYemen, Rep.ZambiaZimbabwe Timeline:
This timeline shows a graph from 1961 to 2015 of Brazil. No data until 1960. Number of actual observations by date: 55.
Source name:
World Development Indicators
Source organization:
World Bank staff estimates based data from International Monetary Fund's Direction of Trade database.
Categories, topics:
Private Sector, Trade
Last updated:
apr 23, 2017
Indicators value changes by year
Minimum:
61.914
jan 1, 2015
Maximum:
90.052
jan 1, 1961
At the date of observation
Value
Absolute change
Change from previous value
jan 1, 1961
90.052
+90.052
0.0%
jan 1, 1962
90.031
-0.021
-0.02%
jan 1, 1963
89.407
-0.624
-0.69%
jan 1, 1964
88.573
-0.834
-0.93%
jan 1, 1965
86.984
-1.589
-1.79%
jan 1, 1966
86.516
-0.469
-0.54%
jan 1, 1967
88.724
+2.208
2.55%
jan 1, 1968
88.223
-0.501
-0.56%
jan 1, 1969
86.87
-1.353
-1.53%
jan 1, 1970
87.601
+0.731
0.84%
jan 1, 1971
89.251
+1.65
1.88%
jan 1, 1972
88.518
-0.732
-0.82%
jan 1, 1973
88.917
+0.398
0.45%
jan 1, 1974
87.597
-1.319
-1.48%
jan 1, 1975
83.115
-4.483
-5.12%
jan 1, 1976
82.723
-0.392
-0.47%
jan 1, 1977
79.349
-3.374
-4.08%
jan 1, 1978
77.975
-1.374
-1.73%
jan 1, 1979
79.014
+1.039
1.33%
jan 1, 1980
71.935
-7.079
-8.96%
jan 1, 1981
69.37
-2.564
-3.56%
jan 1, 1982
72.935
+3.565
5.14%
jan 1, 1983
69.163
-3.772
-5.17%
jan 1, 1984
67.196
-1.967
-2.84%
jan 1, 1985
63.353
-3.843
-5.72%
jan 1, 1986
61.964
-1.388
-2.19%
jan 1, 1987
77.465
+15.501
25.02%
jan 1, 1988
74.656
-2.809
-3.63%
jan 1, 1989
79.132
+4.476
6.0%
jan 1, 1990
77.868
-1.265
-1.6%
jan 1, 1991
79.933
+2.066
2.65%
jan 1, 1992
82.828
+2.894
3.62%
jan 1, 1993
84.794
+1.966
2.37%
jan 1, 1994
86.074
+1.28
1.51%
jan 1, 1995
87.99
+1.916
2.23%
jan 1, 1996
85.977
-2.012
-2.29%
jan 1, 1997
84.404
-1.573
-1.83%
jan 1, 1998
85.096
+0.691
0.82%
jan 1, 1999
87.901
+2.806
3.3%
jan 1, 2000
86.969
-0.932
-1.06%
jan 1, 2001
84.96
-2.01
-2.31%
jan 1, 2002
83.789
-1.171
-1.38%
jan 1, 2003
81.035
-2.754
-3.29%
jan 1, 2004
77.776
-3.259
-4.02%
jan 1, 2005
73.735
-4.041
-5.2%
jan 1, 2006
72.783
-0.951
-1.29%
jan 1, 2007
70.985
-1.798
-2.47%
jan 1, 2008
68.788
-2.197
-3.1%
jan 1, 2009
66.944
-1.844
-2.68%
jan 1, 2010
69.191
+2.247
3.36%
jan 1, 2011
66.99
-2.201
-3.18%
jan 1, 2012
64.836
-2.154
-3.22%
jan 1, 2013
64.237
-0.599
-0.92%
jan 1, 2014
63.38
-0.857
-1.33%
jan 1, 2015
61.914
-1.466
-2.31%
Ranking of countries by current statistics by years


Comments: