29
/
en
AIzaSyAYiBZKx7MnpbEhh9jyipgxe19OcubqV5w
April 1, 2024
140679
Ghana
GHA
true
2
1
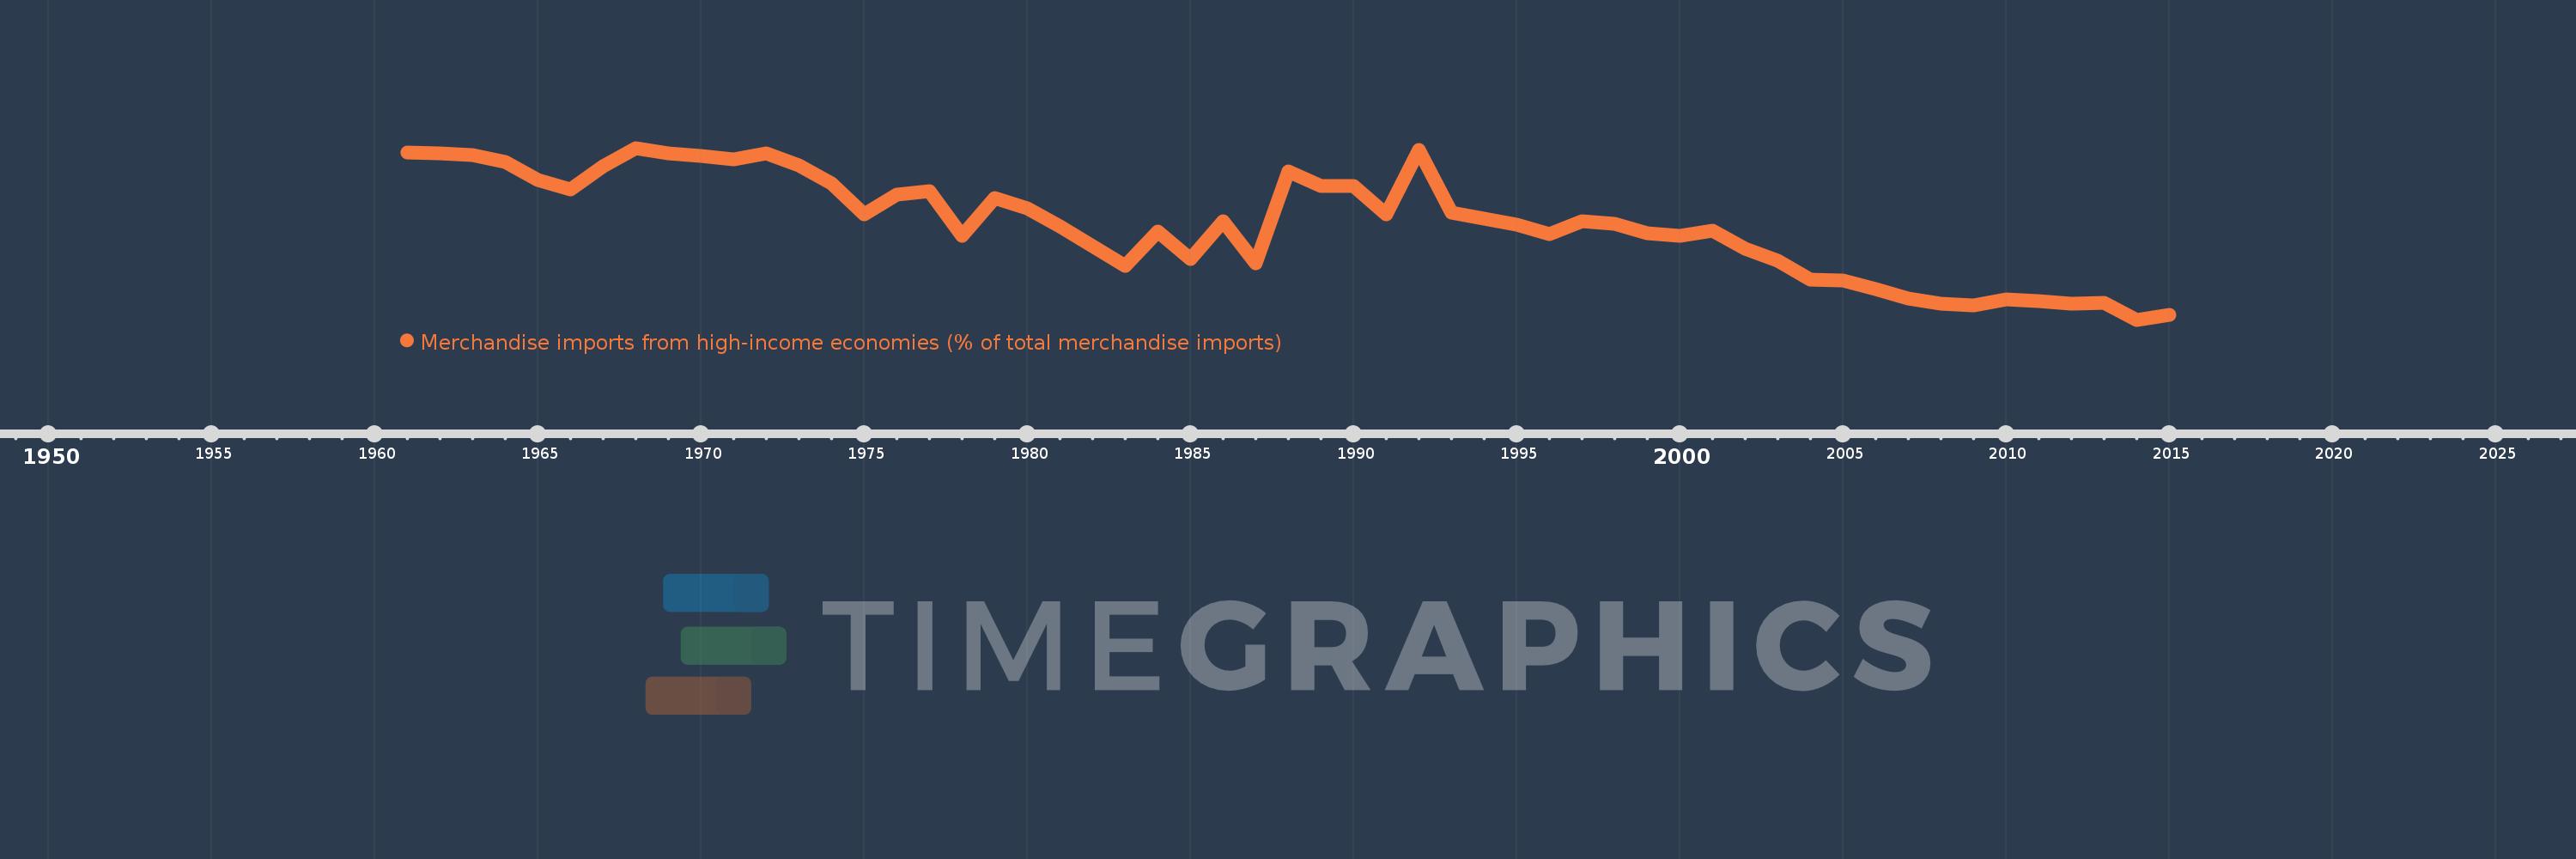
Merchandise imports from high-income economies (% of total merchandise imports)
2015,2014,2013,2012,2011,2010,2009,2008,2007,2006,2005,2004,2003,2002,2001,2000,1999,1998,1997,1996,1995,1994,1993,1992,1991,1990,1989,1988,1987,1986,1985,1984,1983,1982,1981,1980,1979,1978,1977,1976,1975,1974,1973,1972,1971,1970,1969,1968,1967,1966,1965,1964,1963,1962,1961
This statistics in other country:
AfghanistanAlbaniaAlgeriaAngolaAntigua and BarbudaArab WorldArgentinaArmeniaArubaAustraliaAustriaAzerbaijanBahamas, TheBahrainBangladeshBarbadosBelarusBelgiumBelizeBeninBermudaBoliviaBosnia and HerzegovinaBrazilBrunei DarussalamBulgariaBurkina FasoBurundiCabo VerdeCambodiaCameroonCanadaCaribbean small statesCentral African RepublicCentral Europe and the BalticsChadChileChinaColombiaComorosCongo, Dem. Rep.Congo, Rep.Costa RicaCote d'IvoireCroatiaCubaCyprusCzech RepublicDenmarkDjiboutiDominicaDominican RepublicEarly-demographic dividendEast Asia & PacificEast Asia & Pacific (excluding high income)East Asia & Pacific (IDA & IBRD countries)EcuadorEgypt, Arab Rep.El SalvadorEquatorial GuineaEstoniaEthiopiaEuro areaEurope & Central AsiaEurope & Central Asia (excluding high income)Europe & Central Asia (IDA & IBRD countries)European UnionFaroe IslandsFijiFinlandFragile and conflict affected situationsFranceFrench PolynesiaGabonGambia, TheGeorgiaGermanyGhanaGibraltarGreeceGreenlandGrenadaGuamGuatemalaGuineaGuinea-BissauGuyanaHaitiHeavily indebted poor countries (HIPC)High incomeHondurasHong Kong SAR, ChinaHungaryIBRD onlyIcelandIDA & IBRD totalIDA blendIDA onlyIDA totalIndiaIndonesiaIran, Islamic Rep.IraqIrelandIsraelItalyJamaicaJapanJordanKazakhstanKenyaKiribatiKorea, Dem. People’s Rep.Korea, Rep.KosovoKuwaitKyrgyz RepublicLao PDRLate-demographic dividendLatin America & Caribbean Latin America & Caribbean (excluding high income)Latin America & the Caribbean (IDA & IBRD countries)LatviaLeast developed countries: UN classificationLebanonLiberiaLibyaLithuaniaLow & middle incomeLow incomeLower middle incomeLuxembourgMacao SAR, ChinaMacedonia, FYRMadagascarMalawiMalaysiaMaldivesMaliMaltaMauritaniaMauritiusMexicoMiddle East & North AfricaMiddle East & North Africa (excluding high income)Middle East & North Africa (IDA & IBRD countries)Middle incomeMoldovaMongoliaMontenegroMoroccoMozambiqueMyanmarNauruNepalNetherlandsNew CaledoniaNew ZealandNicaraguaNigerNigeriaNorth AmericaNorwayOECD membersOmanOther small statesPacific island small statesPakistanPanamaPapua New GuineaParaguayPeruPhilippinesPolandPortugalPost-demographic dividendPre-demographic dividendQatarRomaniaRussian FederationRwandaSamoaSao Tome and PrincipeSaudi ArabiaSenegalSerbiaSeychellesSierra LeoneSingaporeSlovak RepublicSloveniaSmall statesSolomon IslandsSomaliaSouth AfricaSouth AsiaSouth Asia (IDA & IBRD)SpainSri LankaSt. Kitts and NevisSt. LuciaSt. Vincent and the GrenadinesSub-Saharan Africa Sub-Saharan Africa (excluding high income)Sub-Saharan Africa (IDA & IBRD countries)SudanSurinameSwedenSwitzerlandSyrian Arab RepublicTajikistanTanzaniaThailandTogoTongaTrinidad and TobagoTunisiaTurkeyTurkmenistanTuvaluUgandaUkraineUnited Arab EmiratesUnited KingdomUnited StatesUpper middle incomeUruguayUzbekistanVanuatuVenezuela, RBVietnamWorldYemen, Rep.ZambiaZimbabwe Timeline:
This timeline shows a graph from 1961 to 2015 of Ghana. No data until 1960. Number of actual observations by date: 55.
Source name:
World Development Indicators
Source organization:
World Bank staff estimates based data from International Monetary Fund's Direction of Trade database.
Categories, topics:
Private Sector, Trade
Last updated:
apr 23, 2017
Indicators value changes by year
Minimum:
36.636
jan 1, 2014
Maximum:
85.464
jan 1, 1968
At the date of observation
Value
Absolute change
Change from previous value
jan 1, 1961
84.148
+84.148
0.0%
jan 1, 1962
83.826
-0.322
-0.38%
jan 1, 1963
83.403
-0.423
-0.5%
jan 1, 1964
81.549
-1.855
-2.22%
jan 1, 1965
76.337
-5.211
-6.39%
jan 1, 1966
73.661
-2.677
-3.51%
jan 1, 1967
80.159
+6.499
8.82%
jan 1, 1968
85.464
+5.305
6.62%
jan 1, 1969
84.003
-1.462
-1.71%
jan 1, 1970
83.211
-0.792
-0.94%
jan 1, 1971
82.26
-0.951
-1.14%
jan 1, 1972
83.826
+1.566
1.9%
jan 1, 1973
80.449
-3.378
-4.03%
jan 1, 1974
75.283
-5.165
-6.42%
jan 1, 1975
66.626
-8.657
-11.5%
jan 1, 1976
72.153
+5.527
8.29%
jan 1, 1977
73.177
+1.025
1.42%
jan 1, 1978
60.537
-12.64
-17.27%
jan 1, 1979
71.312
+10.775
17.8%
jan 1, 1980
68.241
-3.072
-4.31%
jan 1, 1981
63.29
-4.951
-7.25%
jan 1, 1982
57.439
-5.851
-9.25%
jan 1, 1983
52.026
-5.412
-9.42%
jan 1, 1984
61.704
+9.677
18.6%
jan 1, 1985
53.799
-7.905
-12.81%
jan 1, 1986
64.557
+10.758
20.0%
jan 1, 1987
52.794
-11.764
-18.22%
jan 1, 1988
78.753
+25.959
49.17%
jan 1, 1989
74.561
-4.191
-5.32%
jan 1, 1990
74.561
0.0
0.0%
jan 1, 1991
66.642
-7.919
-10.62%
jan 1, 1992
84.985
+18.344
27.53%
jan 1, 1993
67.012
-17.973
-21.15%
jan 1, 1994
65.485
-1.527
-2.28%
jan 1, 1995
63.705
-1.78
-2.72%
jan 1, 1996
60.93
-2.775
-4.36%
jan 1, 1997
64.527
+3.597
5.9%
jan 1, 1998
63.944
-0.583
-0.9%
jan 1, 1999
61.099
-2.846
-4.45%
jan 1, 2000
60.591
-0.508
-0.83%
jan 1, 2001
62.047
+1.456
2.4%
jan 1, 2002
56.761
-5.286
-8.52%
jan 1, 2003
53.434
-3.327
-5.86%
jan 1, 2004
48.008
-5.426
-10.15%
jan 1, 2005
47.903
-0.105
-0.22%
jan 1, 2006
45.395
-2.508
-5.24%
jan 1, 2007
42.566
-2.829
-6.23%
jan 1, 2008
41.235
-1.332
-3.13%
jan 1, 2009
40.622
-0.613
-1.49%
jan 1, 2010
42.361
+1.739
4.28%
jan 1, 2011
41.894
-0.467
-1.1%
jan 1, 2012
41.187
-0.707
-1.69%
jan 1, 2013
41.349
+0.162
0.39%
jan 1, 2014
36.636
-4.713
-11.4%
jan 1, 2015
38.148
+1.512
4.13%
Ranking of countries by current statistics by years


Comments: