29
/
en
AIzaSyAYiBZKx7MnpbEhh9jyipgxe19OcubqV5w
April 1, 2024
116020
Cuba
CUB
true
2
1
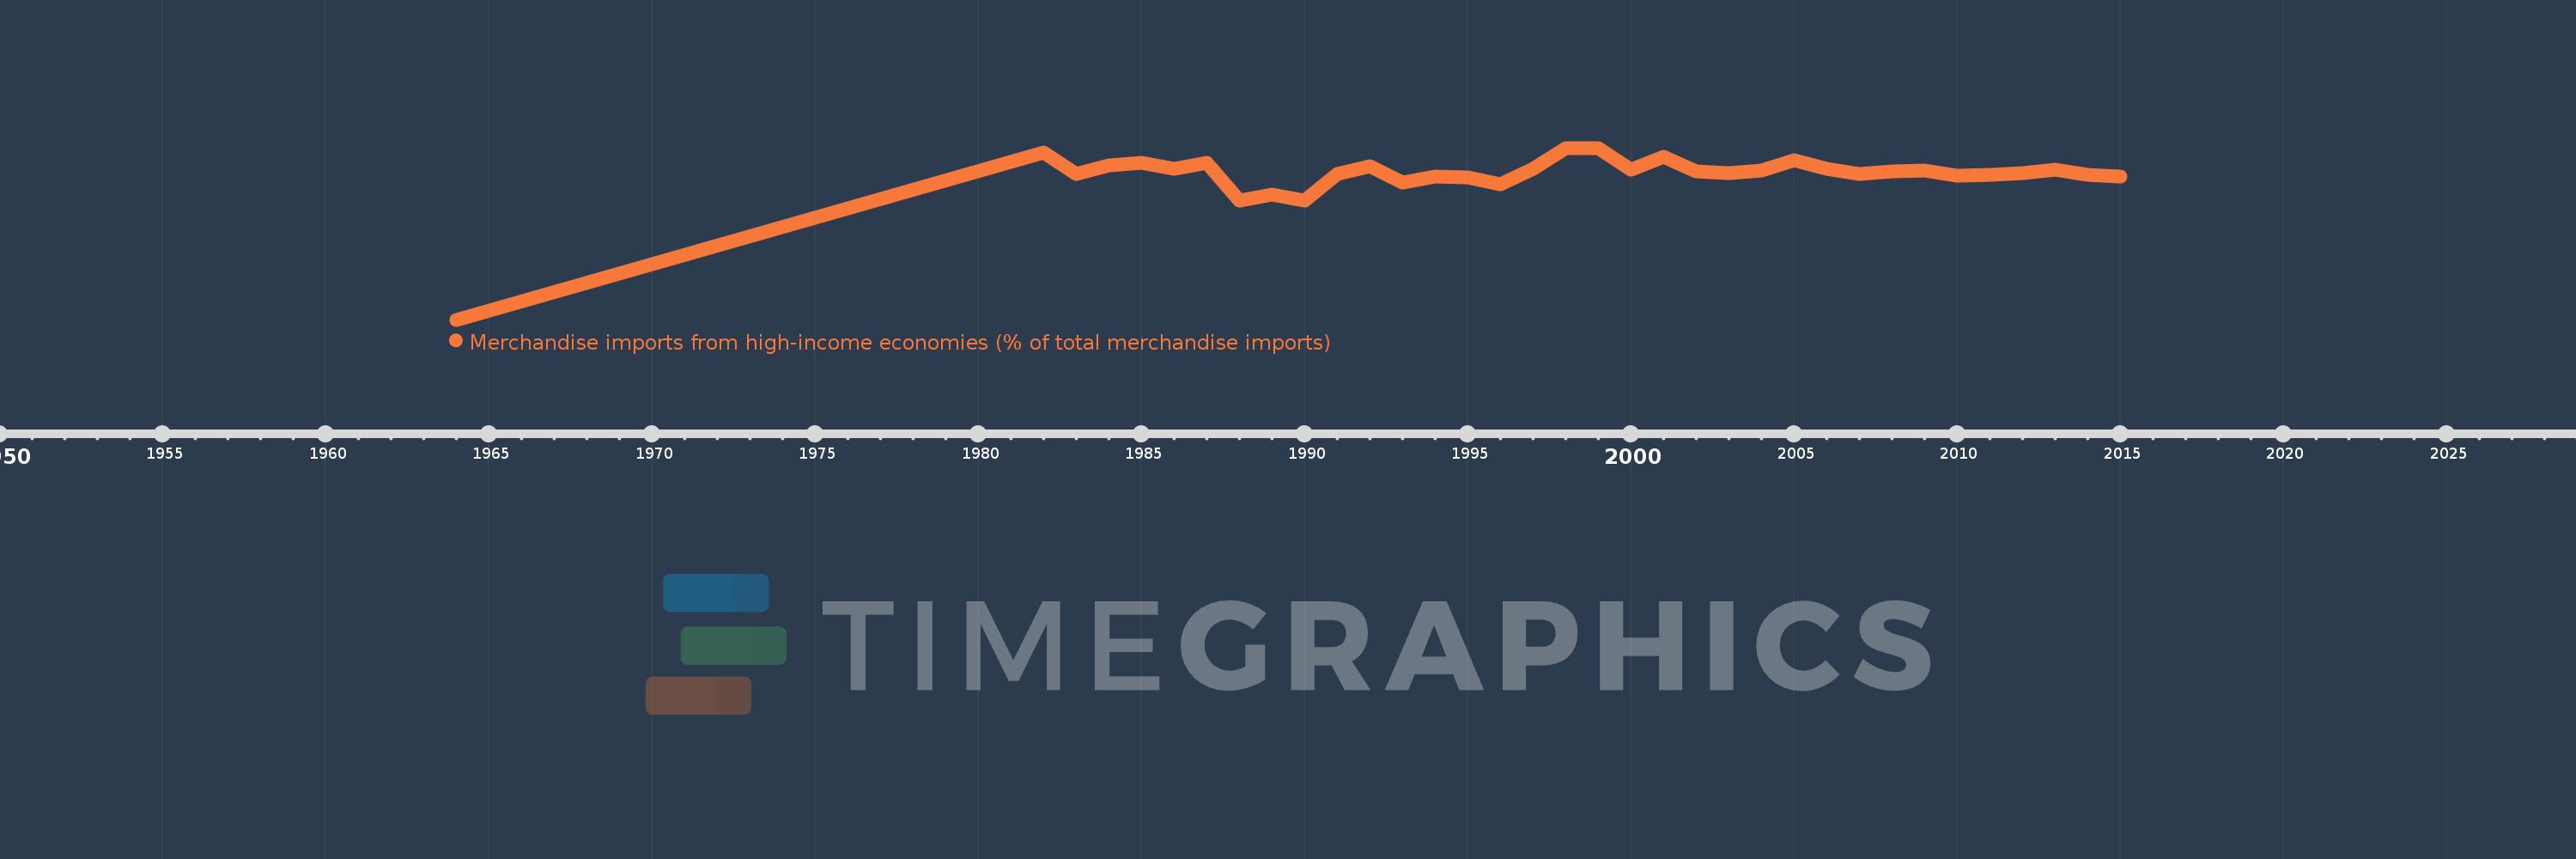
Merchandise imports from high-income economies (% of total merchandise imports)
2015,2014,2013,2012,2011,2010,2009,2008,2007,2006,2005,2004,2003,2002,2001,2000,1999,1998,1997,1996,1995,1994,1993,1992,1991,1990,1989,1988,1987,1986,1985,1984,1983,1982,1964
This statistics in other country:
AfghanistanAlbaniaAlgeriaAngolaAntigua and BarbudaArab WorldArgentinaArmeniaArubaAustraliaAustriaAzerbaijanBahamas, TheBahrainBangladeshBarbadosBelarusBelgiumBelizeBeninBermudaBoliviaBosnia and HerzegovinaBrazilBrunei DarussalamBulgariaBurkina FasoBurundiCabo VerdeCambodiaCameroonCanadaCaribbean small statesCentral African RepublicCentral Europe and the BalticsChadChileChinaColombiaComorosCongo, Dem. Rep.Congo, Rep.Costa RicaCote d'IvoireCroatiaCubaCyprusCzech RepublicDenmarkDjiboutiDominicaDominican RepublicEarly-demographic dividendEast Asia & PacificEast Asia & Pacific (excluding high income)East Asia & Pacific (IDA & IBRD countries)EcuadorEgypt, Arab Rep.El SalvadorEquatorial GuineaEstoniaEthiopiaEuro areaEurope & Central AsiaEurope & Central Asia (excluding high income)Europe & Central Asia (IDA & IBRD countries)European UnionFaroe IslandsFijiFinlandFragile and conflict affected situationsFranceFrench PolynesiaGabonGambia, TheGeorgiaGermanyGhanaGibraltarGreeceGreenlandGrenadaGuamGuatemalaGuineaGuinea-BissauGuyanaHaitiHeavily indebted poor countries (HIPC)High incomeHondurasHong Kong SAR, ChinaHungaryIBRD onlyIcelandIDA & IBRD totalIDA blendIDA onlyIDA totalIndiaIndonesiaIran, Islamic Rep.IraqIrelandIsraelItalyJamaicaJapanJordanKazakhstanKenyaKiribatiKorea, Dem. People’s Rep.Korea, Rep.KosovoKuwaitKyrgyz RepublicLao PDRLate-demographic dividendLatin America & Caribbean Latin America & Caribbean (excluding high income)Latin America & the Caribbean (IDA & IBRD countries)LatviaLeast developed countries: UN classificationLebanonLiberiaLibyaLithuaniaLow & middle incomeLow incomeLower middle incomeLuxembourgMacao SAR, ChinaMacedonia, FYRMadagascarMalawiMalaysiaMaldivesMaliMaltaMauritaniaMauritiusMexicoMiddle East & North AfricaMiddle East & North Africa (excluding high income)Middle East & North Africa (IDA & IBRD countries)Middle incomeMoldovaMongoliaMontenegroMoroccoMozambiqueMyanmarNauruNepalNetherlandsNew CaledoniaNew ZealandNicaraguaNigerNigeriaNorth AmericaNorwayOECD membersOmanOther small statesPacific island small statesPakistanPanamaPapua New GuineaParaguayPeruPhilippinesPolandPortugalPost-demographic dividendPre-demographic dividendQatarRomaniaRussian FederationRwandaSamoaSao Tome and PrincipeSaudi ArabiaSenegalSerbiaSeychellesSierra LeoneSingaporeSlovak RepublicSloveniaSmall statesSolomon IslandsSomaliaSouth AfricaSouth AsiaSouth Asia (IDA & IBRD)SpainSri LankaSt. Kitts and NevisSt. LuciaSt. Vincent and the GrenadinesSub-Saharan Africa Sub-Saharan Africa (excluding high income)Sub-Saharan Africa (IDA & IBRD countries)SudanSurinameSwedenSwitzerlandSyrian Arab RepublicTajikistanTanzaniaThailandTogoTongaTrinidad and TobagoTunisiaTurkeyTurkmenistanTuvaluUgandaUkraineUnited Arab EmiratesUnited KingdomUnited StatesUpper middle incomeUruguayUzbekistanVanuatuVenezuela, RBVietnamWorldYemen, Rep.ZambiaZimbabwe Timeline:
This timeline shows a graph from 1964 to 2015 of Cuba. No data until 1963. Number of actual observations by date: 35.
Source name:
World Development Indicators
Source organization:
World Bank staff estimates based data from International Monetary Fund's Direction of Trade database.
Categories, topics:
Private Sector, Trade
Last updated:
apr 23, 2017
Indicators value changes by year
At the date of observation
Value
Absolute change
Change from previous value
jan 1, 1982
80.281
+80.281
%
jan 1, 1983
70.032
-10.249
-12.77%
jan 1, 1984
74.152
+4.119
5.88%
jan 1, 1985
75.379
+1.228
1.66%
jan 1, 1986
72.374
-3.005
-3.99%
jan 1, 1987
75.592
+3.218
4.45%
jan 1, 1988
57.147
-18.445
-24.4%
jan 1, 1989
60.3
+3.153
5.52%
jan 1, 1990
57.355
-2.945
-4.88%
jan 1, 1991
70.043
+12.689
22.12%
jan 1, 1992
73.704
+3.66
5.23%
jan 1, 1993
65.792
-7.912
-10.73%
jan 1, 1994
68.713
+2.921
4.44%
jan 1, 1995
68.34
-0.373
-0.54%
jan 1, 1996
64.979
-3.361
-4.92%
jan 1, 1997
72.464
+7.485
11.52%
jan 1, 1998
82.56
+10.095
13.93%
jan 1, 1999
82.516
-0.043
-0.05%
jan 1, 2000
71.94
-10.577
-12.82%
jan 1, 2001
78.259
+6.32
8.78%
jan 1, 2002
71.088
-7.172
-9.16%
jan 1, 2003
70.395
-0.693
-0.97%
jan 1, 2004
71.79
+1.395
1.98%
jan 1, 2005
76.777
+4.987
6.95%
jan 1, 2006
72.431
-4.346
-5.66%
jan 1, 2007
69.858
-2.573
-3.55%
jan 1, 2008
71.488
+1.63
2.33%
jan 1, 2009
71.751
+0.263
0.37%
jan 1, 2010
69.346
-2.405
-3.35%
jan 1, 2011
69.706
+0.36
0.52%
jan 1, 2012
70.396
+0.69
0.99%
jan 1, 2013
71.999
+1.602
2.28%
jan 1, 2014
69.504
-2.495
-3.47%
jan 1, 2015
68.933
-0.571
-0.82%
Ranking of countries by current statistics by years


Comments: