29
/
en
AIzaSyAYiBZKx7MnpbEhh9jyipgxe19OcubqV5w
April 1, 2024
77366
Bahrain
BHR
true
2
1
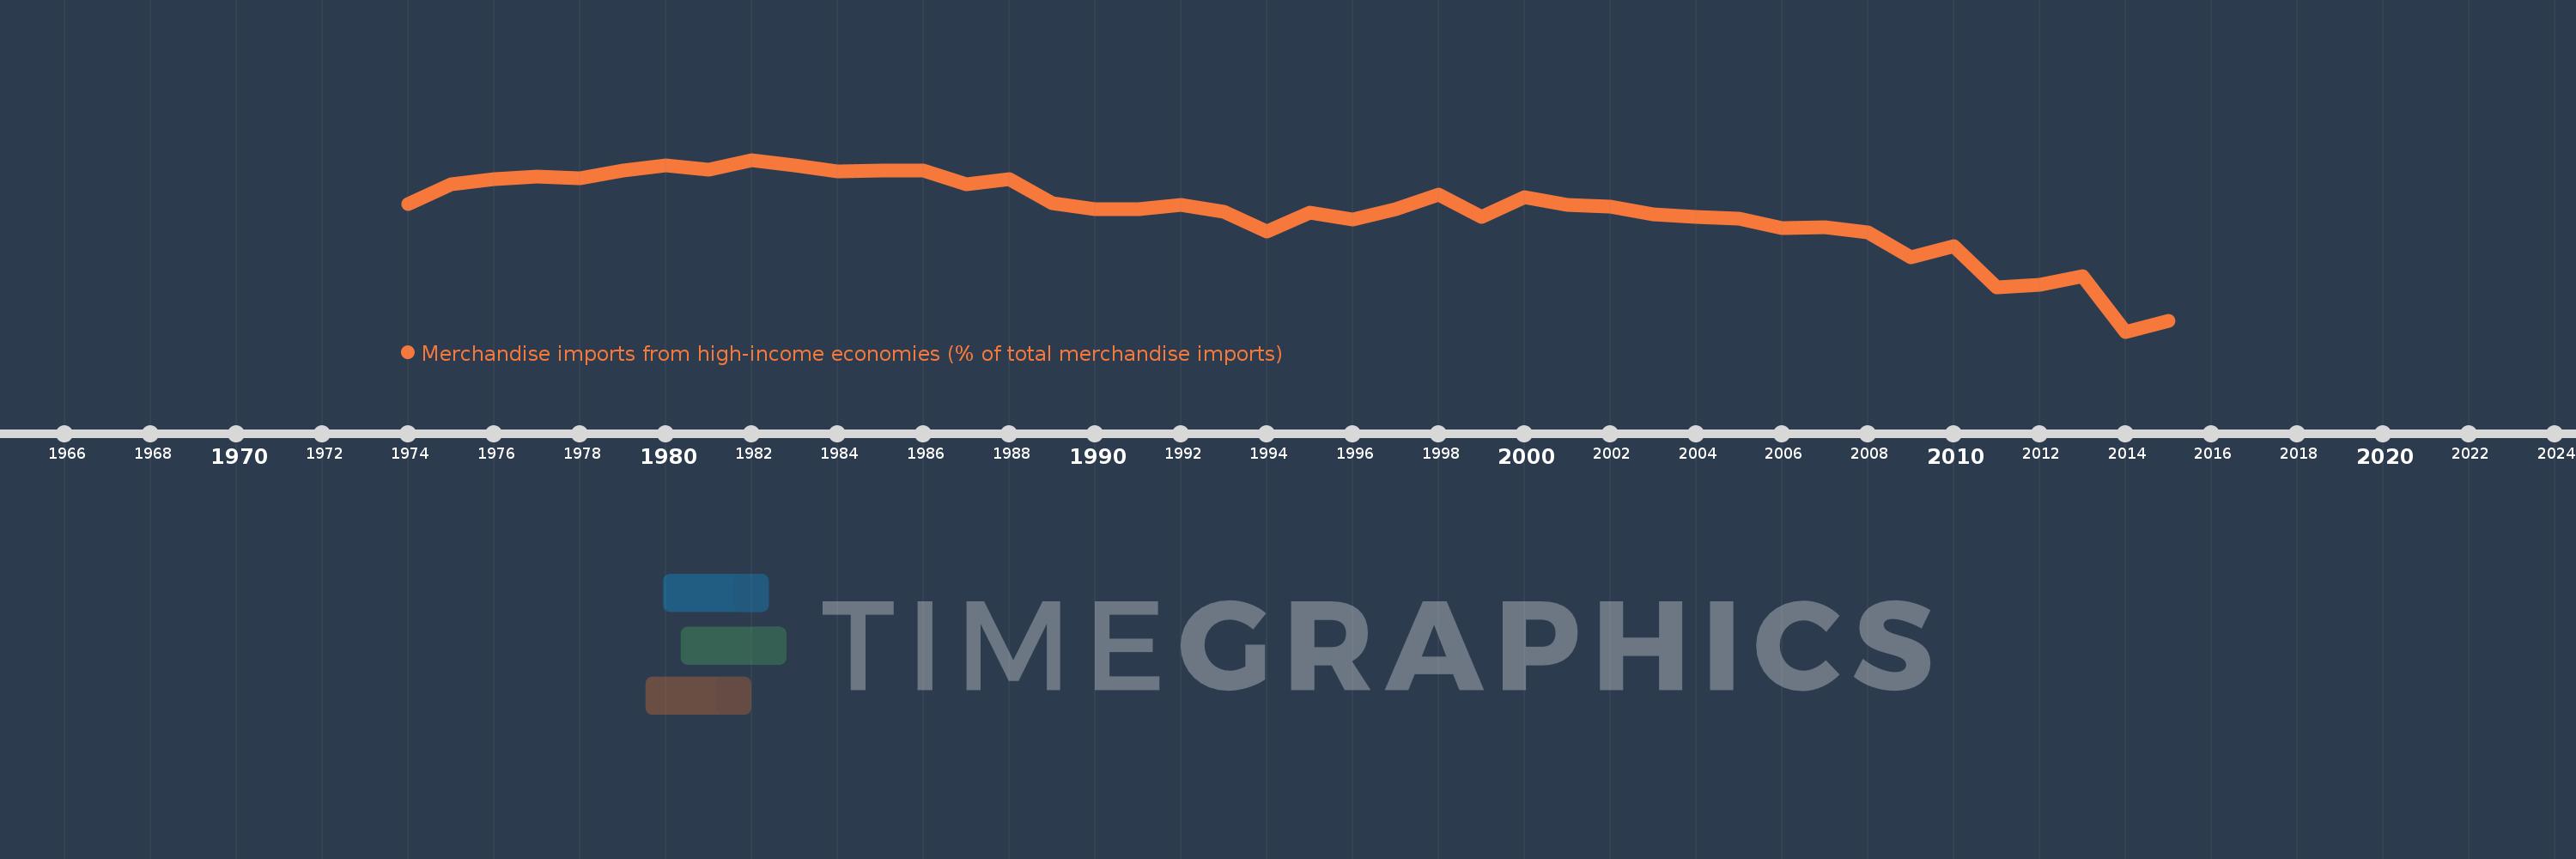
Merchandise imports from high-income economies (% of total merchandise imports)
2015,2014,2013,2012,2011,2010,2009,2008,2007,2006,2005,2004,2003,2002,2001,2000,1999,1998,1997,1996,1995,1994,1993,1992,1991,1990,1989,1988,1987,1986,1985,1984,1983,1982,1981,1980,1979,1978,1977,1976,1975,1974
This statistics in other country:
AfghanistanAlbaniaAlgeriaAngolaAntigua and BarbudaArab WorldArgentinaArmeniaArubaAustraliaAustriaAzerbaijanBahamas, TheBahrainBangladeshBarbadosBelarusBelgiumBelizeBeninBermudaBoliviaBosnia and HerzegovinaBrazilBrunei DarussalamBulgariaBurkina FasoBurundiCabo VerdeCambodiaCameroonCanadaCaribbean small statesCentral African RepublicCentral Europe and the BalticsChadChileChinaColombiaComorosCongo, Dem. Rep.Congo, Rep.Costa RicaCote d'IvoireCroatiaCubaCyprusCzech RepublicDenmarkDjiboutiDominicaDominican RepublicEarly-demographic dividendEast Asia & PacificEast Asia & Pacific (excluding high income)East Asia & Pacific (IDA & IBRD countries)EcuadorEgypt, Arab Rep.El SalvadorEquatorial GuineaEstoniaEthiopiaEuro areaEurope & Central AsiaEurope & Central Asia (excluding high income)Europe & Central Asia (IDA & IBRD countries)European UnionFaroe IslandsFijiFinlandFragile and conflict affected situationsFranceFrench PolynesiaGabonGambia, TheGeorgiaGermanyGhanaGibraltarGreeceGreenlandGrenadaGuamGuatemalaGuineaGuinea-BissauGuyanaHaitiHeavily indebted poor countries (HIPC)High incomeHondurasHong Kong SAR, ChinaHungaryIBRD onlyIcelandIDA & IBRD totalIDA blendIDA onlyIDA totalIndiaIndonesiaIran, Islamic Rep.IraqIrelandIsraelItalyJamaicaJapanJordanKazakhstanKenyaKiribatiKorea, Dem. People’s Rep.Korea, Rep.KosovoKuwaitKyrgyz RepublicLao PDRLate-demographic dividendLatin America & Caribbean Latin America & Caribbean (excluding high income)Latin America & the Caribbean (IDA & IBRD countries)LatviaLeast developed countries: UN classificationLebanonLiberiaLibyaLithuaniaLow & middle incomeLow incomeLower middle incomeLuxembourgMacao SAR, ChinaMacedonia, FYRMadagascarMalawiMalaysiaMaldivesMaliMaltaMauritaniaMauritiusMexicoMiddle East & North AfricaMiddle East & North Africa (excluding high income)Middle East & North Africa (IDA & IBRD countries)Middle incomeMoldovaMongoliaMontenegroMoroccoMozambiqueMyanmarNauruNepalNetherlandsNew CaledoniaNew ZealandNicaraguaNigerNigeriaNorth AmericaNorwayOECD membersOmanOther small statesPacific island small statesPakistanPanamaPapua New GuineaParaguayPeruPhilippinesPolandPortugalPost-demographic dividendPre-demographic dividendQatarRomaniaRussian FederationRwandaSamoaSao Tome and PrincipeSaudi ArabiaSenegalSerbiaSeychellesSierra LeoneSingaporeSlovak RepublicSloveniaSmall statesSolomon IslandsSomaliaSouth AfricaSouth AsiaSouth Asia (IDA & IBRD)SpainSri LankaSt. Kitts and NevisSt. LuciaSt. Vincent and the GrenadinesSub-Saharan Africa Sub-Saharan Africa (excluding high income)Sub-Saharan Africa (IDA & IBRD countries)SudanSurinameSwedenSwitzerlandSyrian Arab RepublicTajikistanTanzaniaThailandTogoTongaTrinidad and TobagoTunisiaTurkeyTurkmenistanTuvaluUgandaUkraineUnited Arab EmiratesUnited KingdomUnited StatesUpper middle incomeUruguayUzbekistanVanuatuVenezuela, RBVietnamWorldYemen, Rep.ZambiaZimbabwe Timeline:
This timeline shows a graph from 1974 to 2015 of Bahrain. No data until 1973. Number of actual observations by date: 42.
Source name:
World Development Indicators
Source organization:
World Bank staff estimates based data from International Monetary Fund's Direction of Trade database.
Categories, topics:
Private Sector, Trade
Last updated:
apr 23, 2017
Indicators value changes by year
Minimum:
65.771
jan 1, 2014
Maximum:
95.357
jan 1, 1982
At the date of observation
Value
Absolute change
Change from previous value
jan 1, 1974
87.754
+87.754
0.0%
jan 1, 1975
91.125
+3.371
3.84%
jan 1, 1976
92.098
+0.973
1.07%
jan 1, 1977
92.429
+0.33
0.36%
jan 1, 1978
92.176
-0.253
-0.27%
jan 1, 1979
93.441
+1.265
1.37%
jan 1, 1980
94.402
+0.961
1.03%
jan 1, 1981
93.643
-0.759
-0.8%
jan 1, 1982
95.357
+1.714
1.83%
jan 1, 1983
94.337
-1.02
-1.07%
jan 1, 1984
93.305
-1.033
-1.09%
jan 1, 1985
93.486
+0.181
0.19%
jan 1, 1986
93.486
+0.0
0.0%
jan 1, 1987
91.097
-2.389
-2.56%
jan 1, 1988
92.048
+0.95
1.04%
jan 1, 1989
87.869
-4.178
-4.54%
jan 1, 1990
86.877
-0.992
-1.13%
jan 1, 1991
86.843
-0.034
-0.04%
jan 1, 1992
87.528
+0.684
0.79%
jan 1, 1993
86.459
-1.068
-1.22%
jan 1, 1994
82.956
-3.503
-4.05%
jan 1, 1995
86.318
+3.362
4.05%
jan 1, 1996
85.146
-1.172
-1.36%
jan 1, 1997
86.866
+1.72
2.02%
jan 1, 1998
89.31
+2.444
2.81%
jan 1, 1999
85.546
-3.764
-4.22%
jan 1, 2000
88.958
+3.413
3.99%
jan 1, 2001
87.603
-1.356
-1.52%
jan 1, 2002
87.237
-0.366
-0.42%
jan 1, 2003
86.032
-1.205
-1.38%
jan 1, 2004
85.592
-0.44
-0.51%
jan 1, 2005
85.197
-0.395
-0.46%
jan 1, 2006
83.623
-1.574
-1.85%
jan 1, 2007
83.816
+0.193
0.23%
jan 1, 2008
82.791
-1.025
-1.22%
jan 1, 2009
78.532
-4.259
-5.14%
jan 1, 2010
80.513
+1.982
2.52%
jan 1, 2011
73.427
-7.086
-8.8%
jan 1, 2012
73.791
+0.364
0.5%
jan 1, 2013
75.362
+1.57
2.13%
jan 1, 2014
65.771
-9.591
-12.73%
jan 1, 2015
67.563
+1.792
2.72%
Ranking of countries by current statistics by years


Comments: